Speculatory Divergence
There has been a growing divergence in performance between Bitcoin and Ethereum during the 2023-23 cycle thus far. This has manifested as weaker price performance for ETH, and can be explained by an overall weaker capital rotation trend, especially relative to past cycles and ATH breaks.


Executive Summary
- The Fourth Bitcoin Halving initially led to a sell-off, with BTC prices falling to $57k before recovering swiftly. This is now the deepest pullback since the FTX lows.
- Ethereum exhibited similar price performance, experiencing its maximum drawdown of this cycle which was twice as severe as Bitcoin's.
- Ethereum's under-performance this cycle relative to Bitcoin is reflected in a measurable lag in speculative interest from the Short-Term Holder cohort.
- Both assets still have a relatively low Realized Cap associated with Long-Term Holders, suggesting the market is likely within the early stages of a macro uptrend.
Price Performance
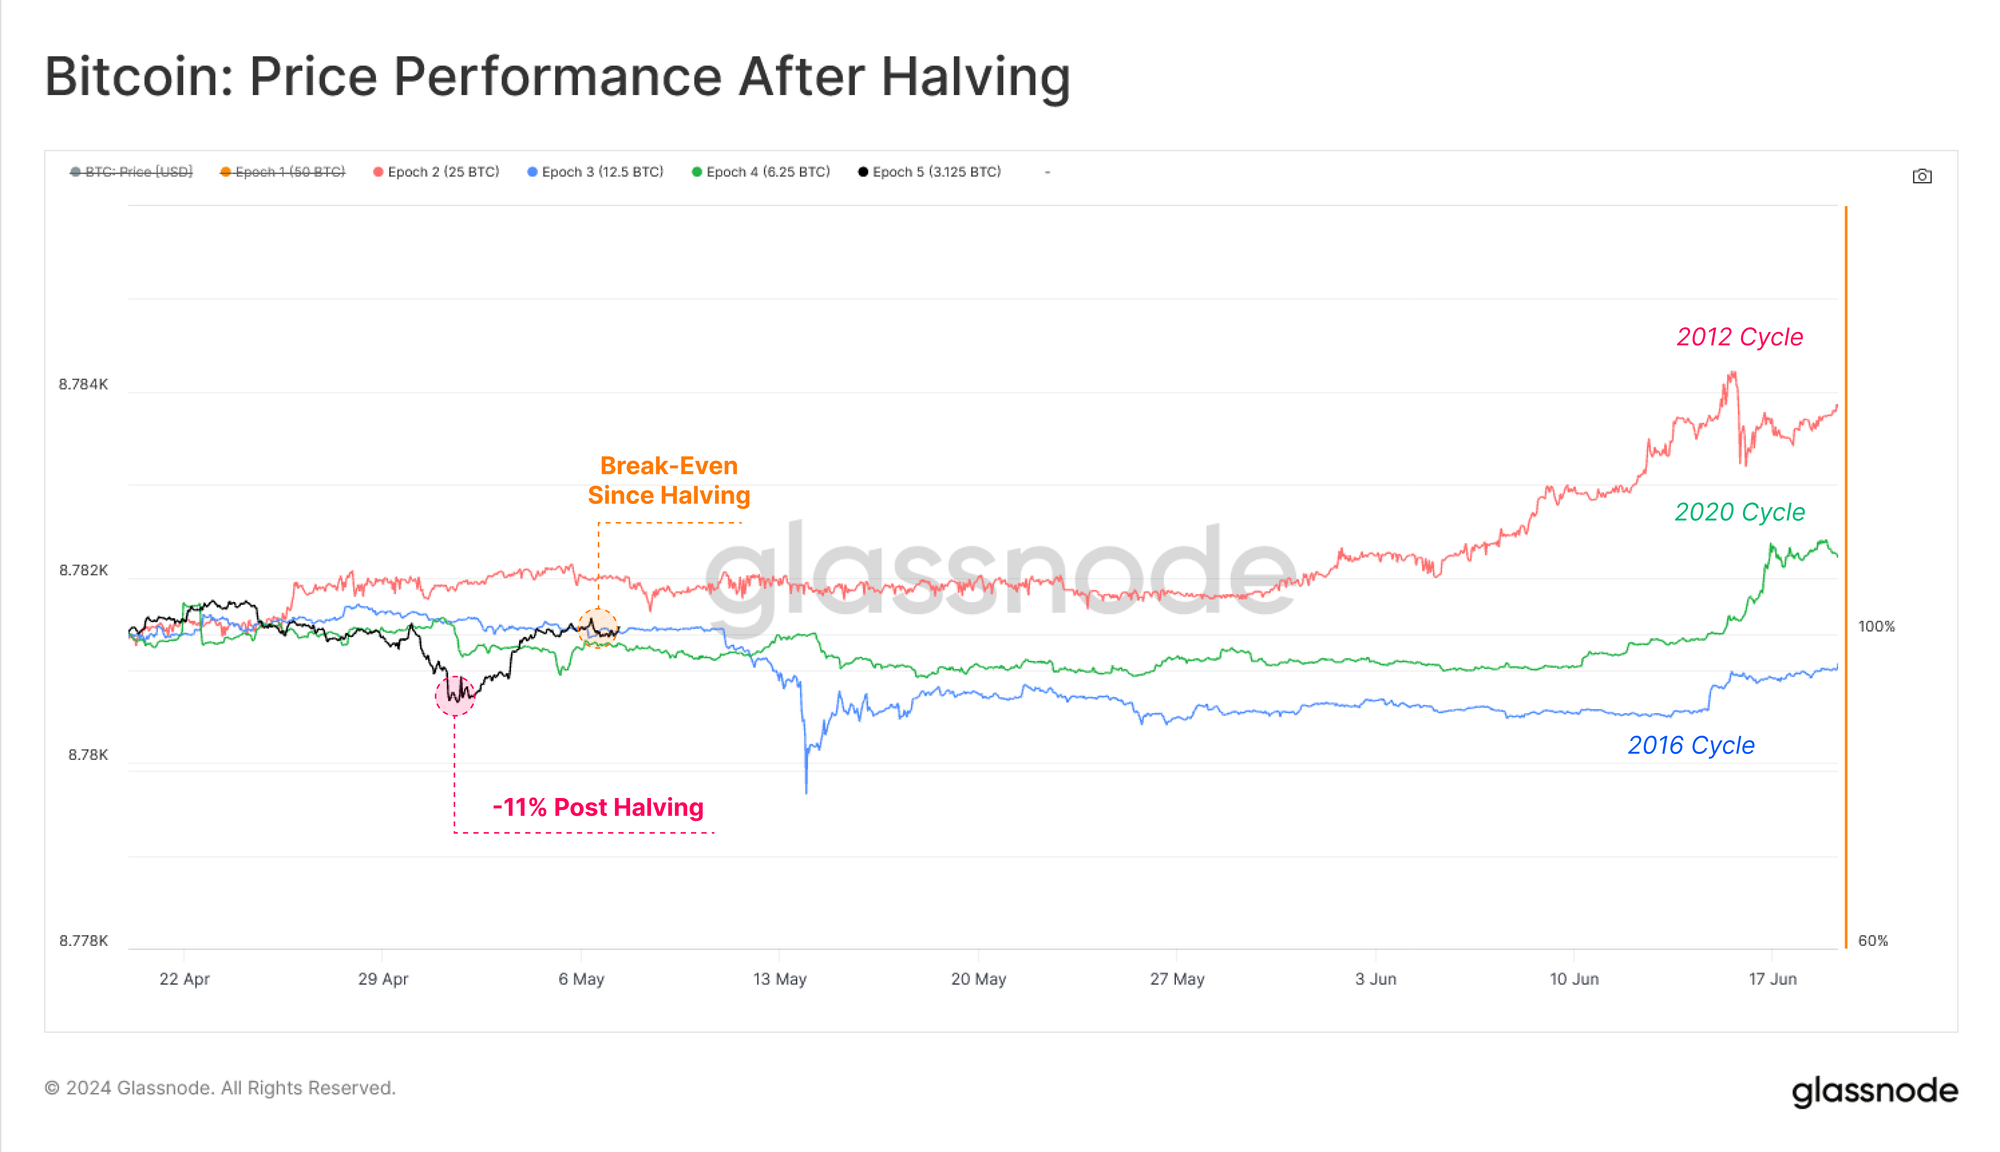
Bitcoin halving events are well publicised in advance, and have historically been a choppy sell-the-news event in the immediate term. The fourth halving was no exception, with the BTC price selling off by -11%, and trading into the $57k region. This is the lowest price over the last 2 months, although the market has recovered to be flat since the halving date.
Strangely enough, both of the prior two halving cycles saw price flat after two weeks, with only the first halving seeing an +11% gain. In general, the 60-days after halving events tend to be choppy, sideways, with a slight downwards drift to the of around of -5% to -15%.
- 🔴 Epoch 2: +9.0%
- 🔵Epoch 3: +0.4%
- 🟢Epoch 4: -1.5%
- ⚫ Epoch 5: 0.3%
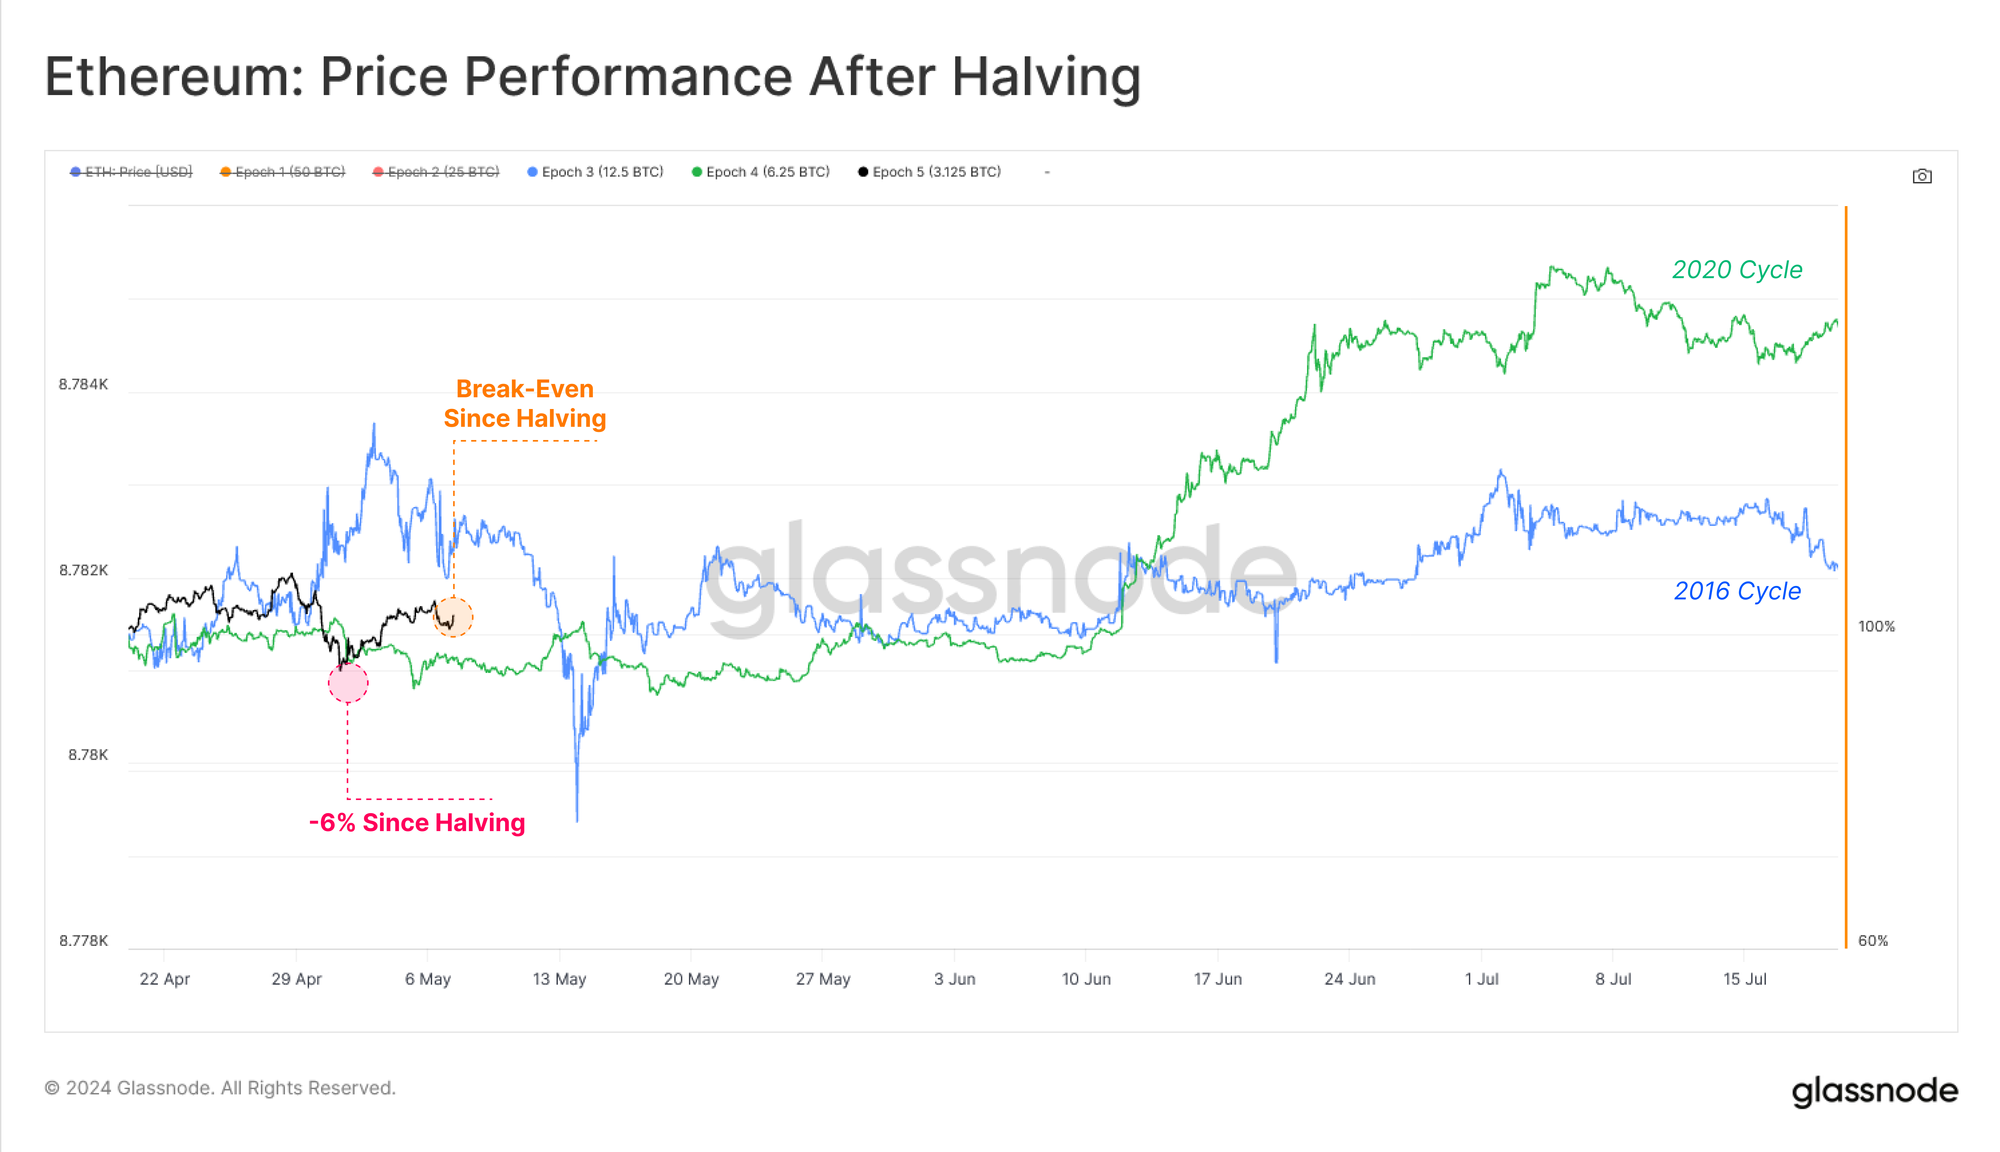
Ethereum prices experienced a similar gravity, following the Bitcoin price lower immediately after the halving, and recording the worst post-halving performance on record. However in the following days, ETH prices have similarly recovered, bringing overall performance into positive territory.
- 🔵 Epoch 3: +16%
- 🟢 Epoch 4: -4%
- ⚫ Epoch 5: +1.5%
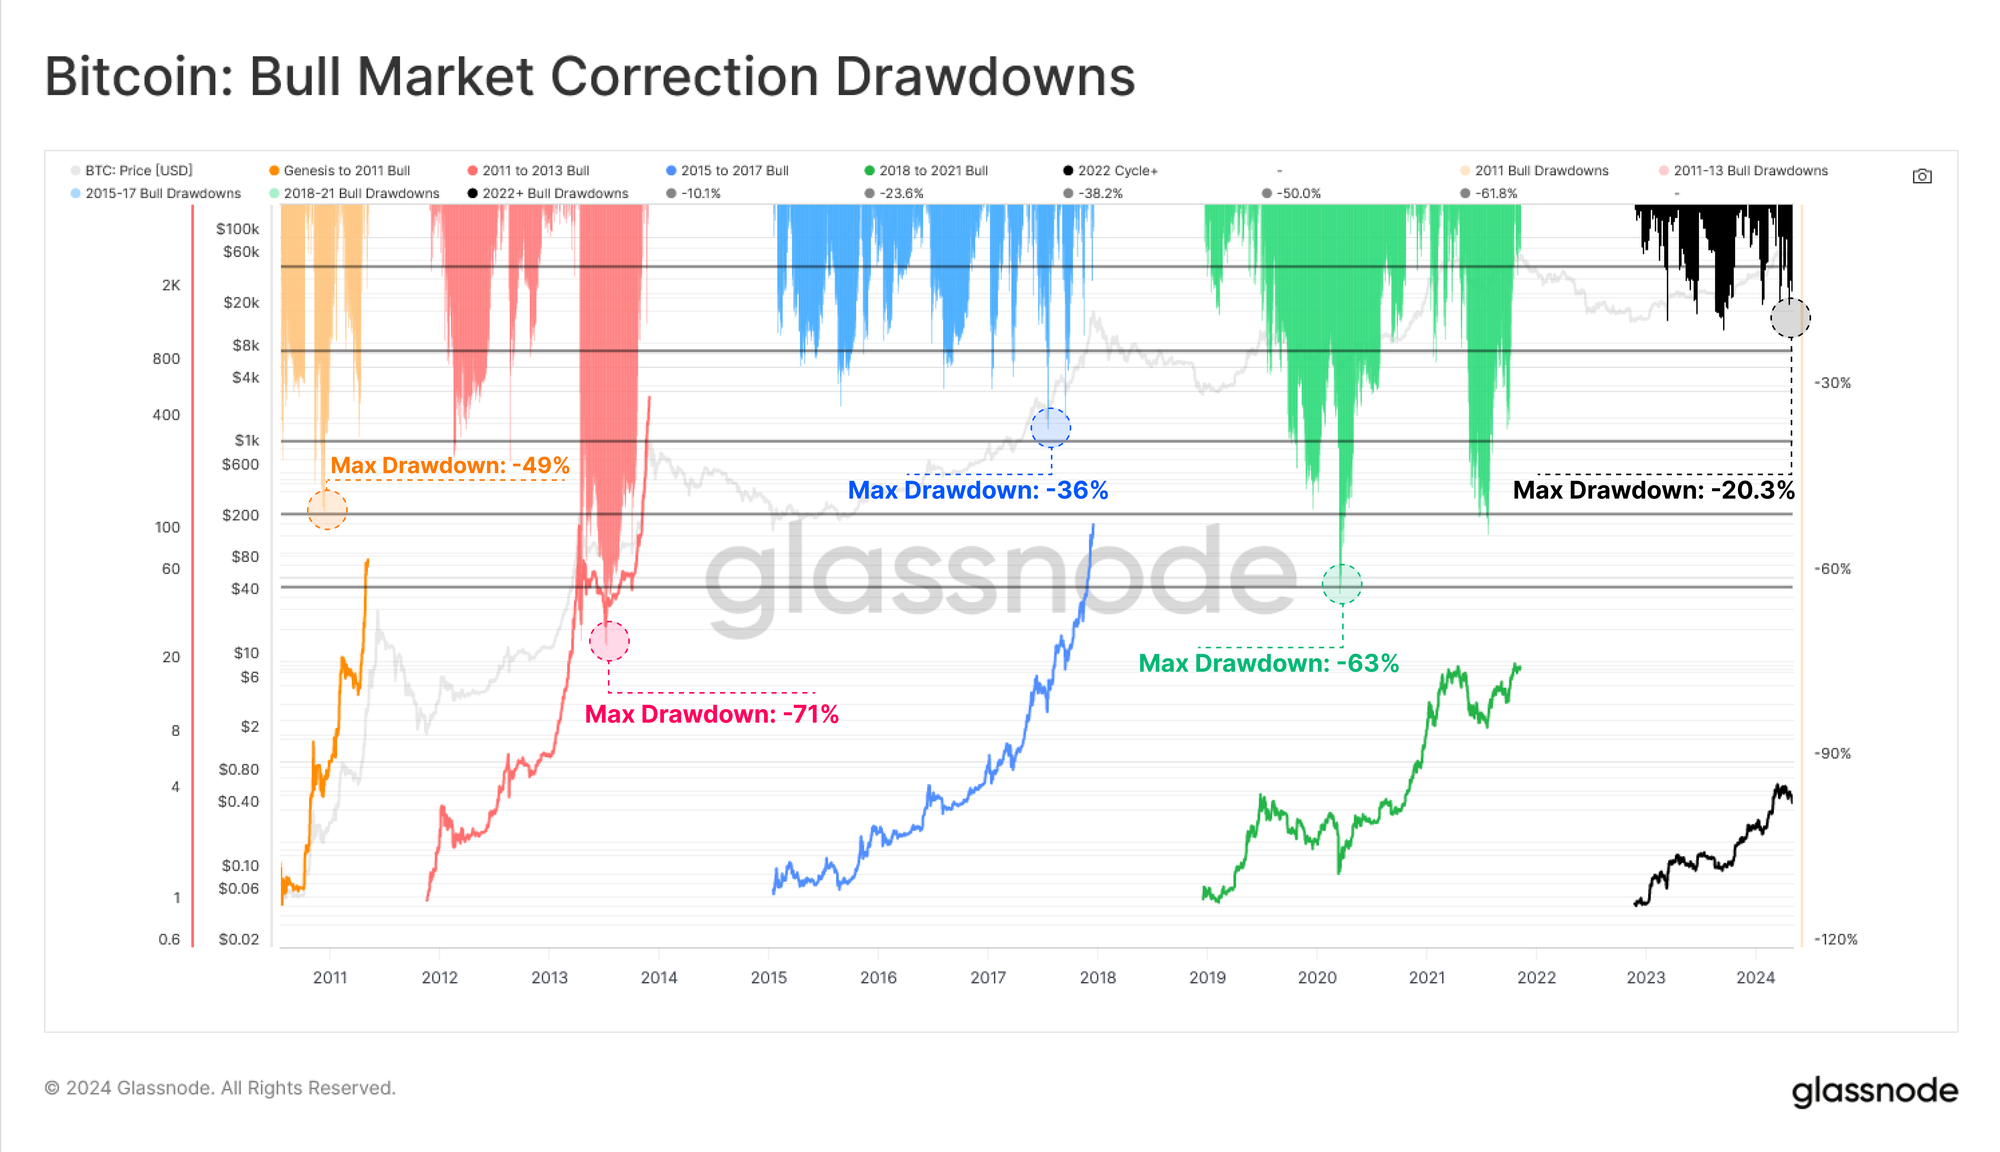
Measured from the $73k ATH, Bitcoin prices corrected by -20.3%, which is the deepest correction on a closing basis since the FTX lows in Nov-2022. That said, this macro uptrend still appears to be one of the more resilient in history, with comparatively shallow corrections thus far.
Of note, we can also observe a strikingly similarity in drawdown structure between our current cycle, and the 2015-17 Bull Market (blue). The 2015-17 uptrend occurred during Bitcoin’s infancy, with no derivative instruments available for the asset class. As such, this rally was entirely a spot driven market, which perhaps gives some indication that the current market structure may bear some similarities.
A great deal of the leverage from the 2020-22 cycle was washed out in 2022, and the new US ETFs have added a non-trivial new vector for demand in spot markets.
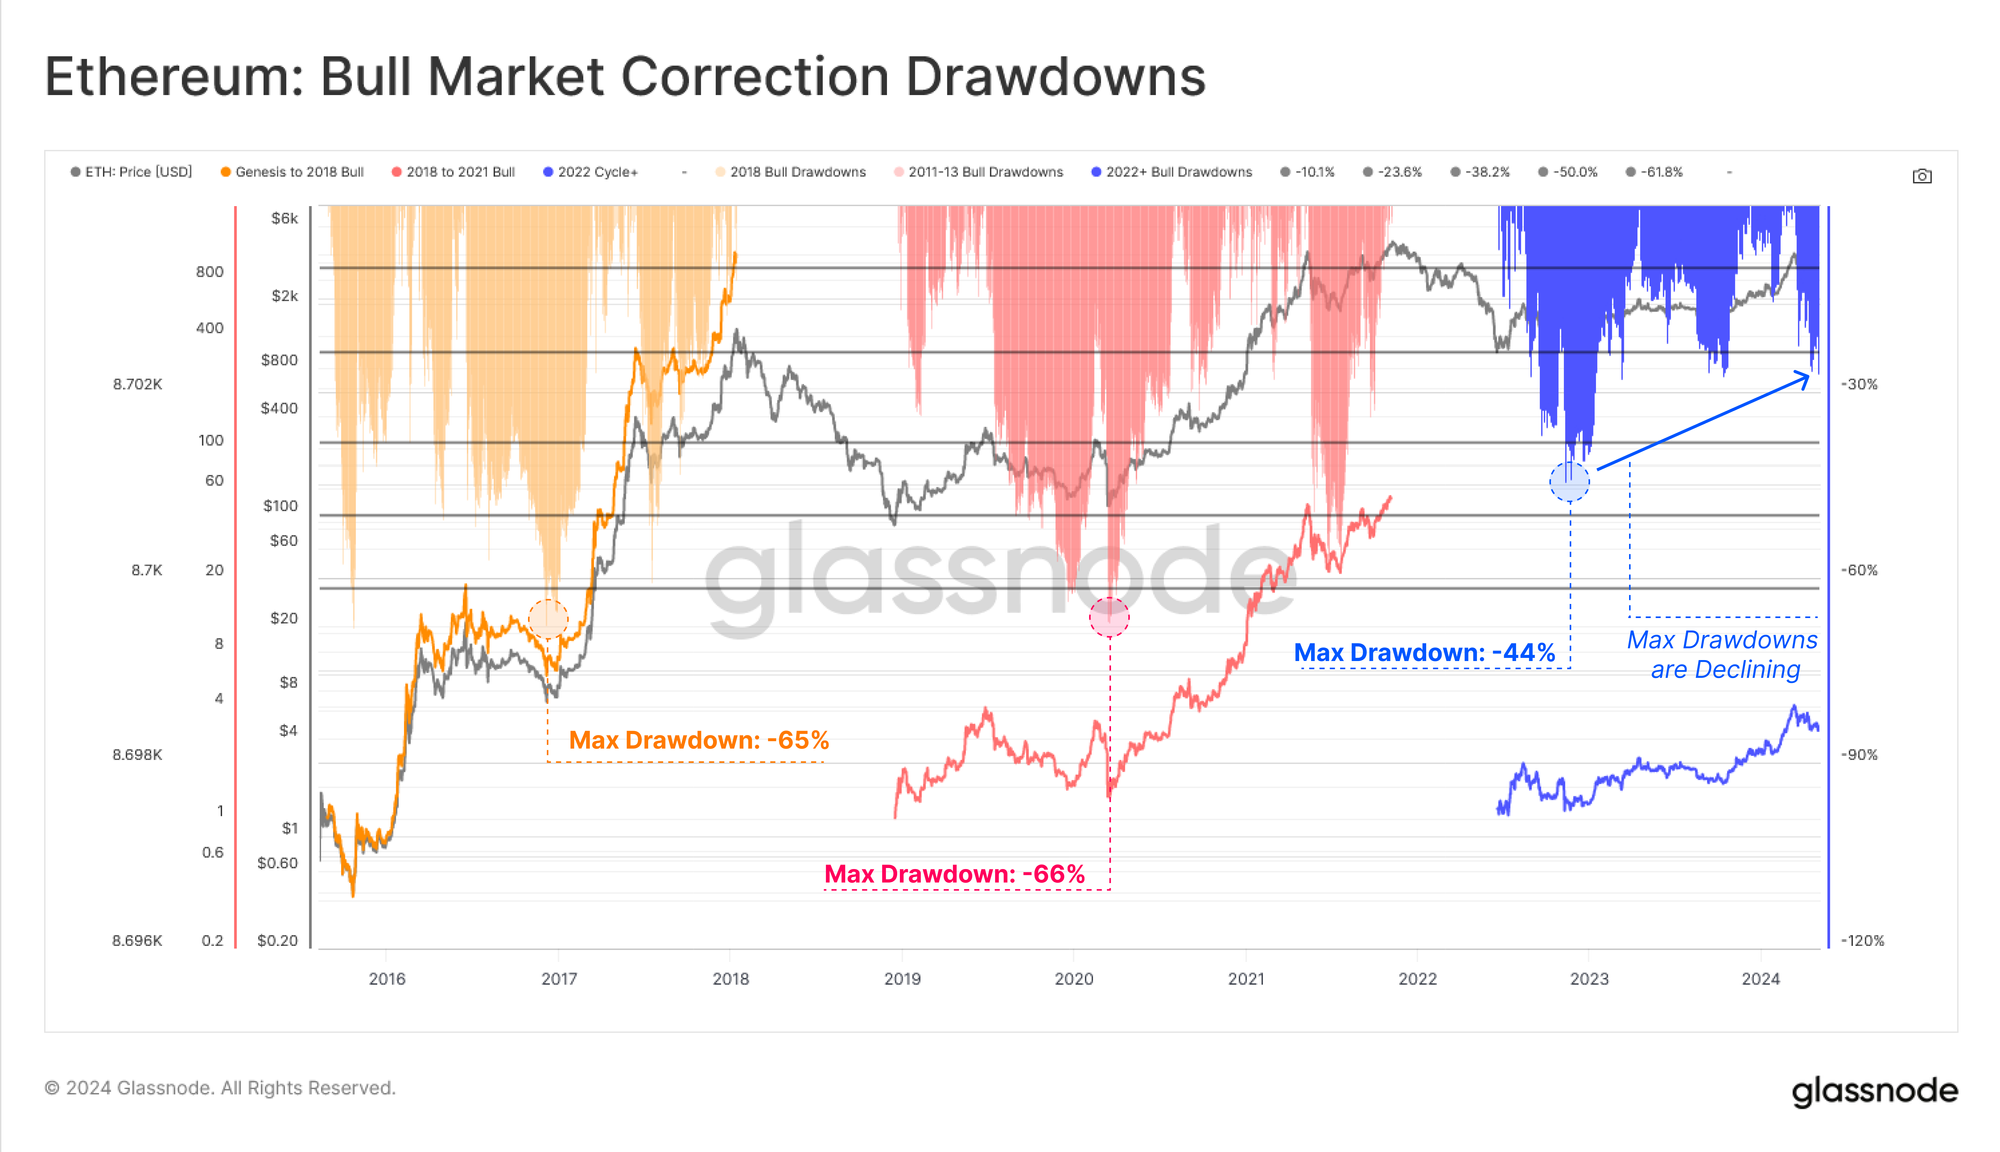
For Ethereum, we can see a similar drawdown structure, with notably shallower corrections since the FTX lows. This hits to a degree of resilience during pullbacks, as well as a net reduction in volatility across the digital asset space.
However, it is worth noting that Ethereum's deepest drawdown of the cycle has been -44%, which is just over twice as severe as Bitcoin’s at -21%. This highlights Ethereum's relative under-performance over last 2 years, which is manifesting in a weaker ETH/BTC ratio also.
Investor Positioning
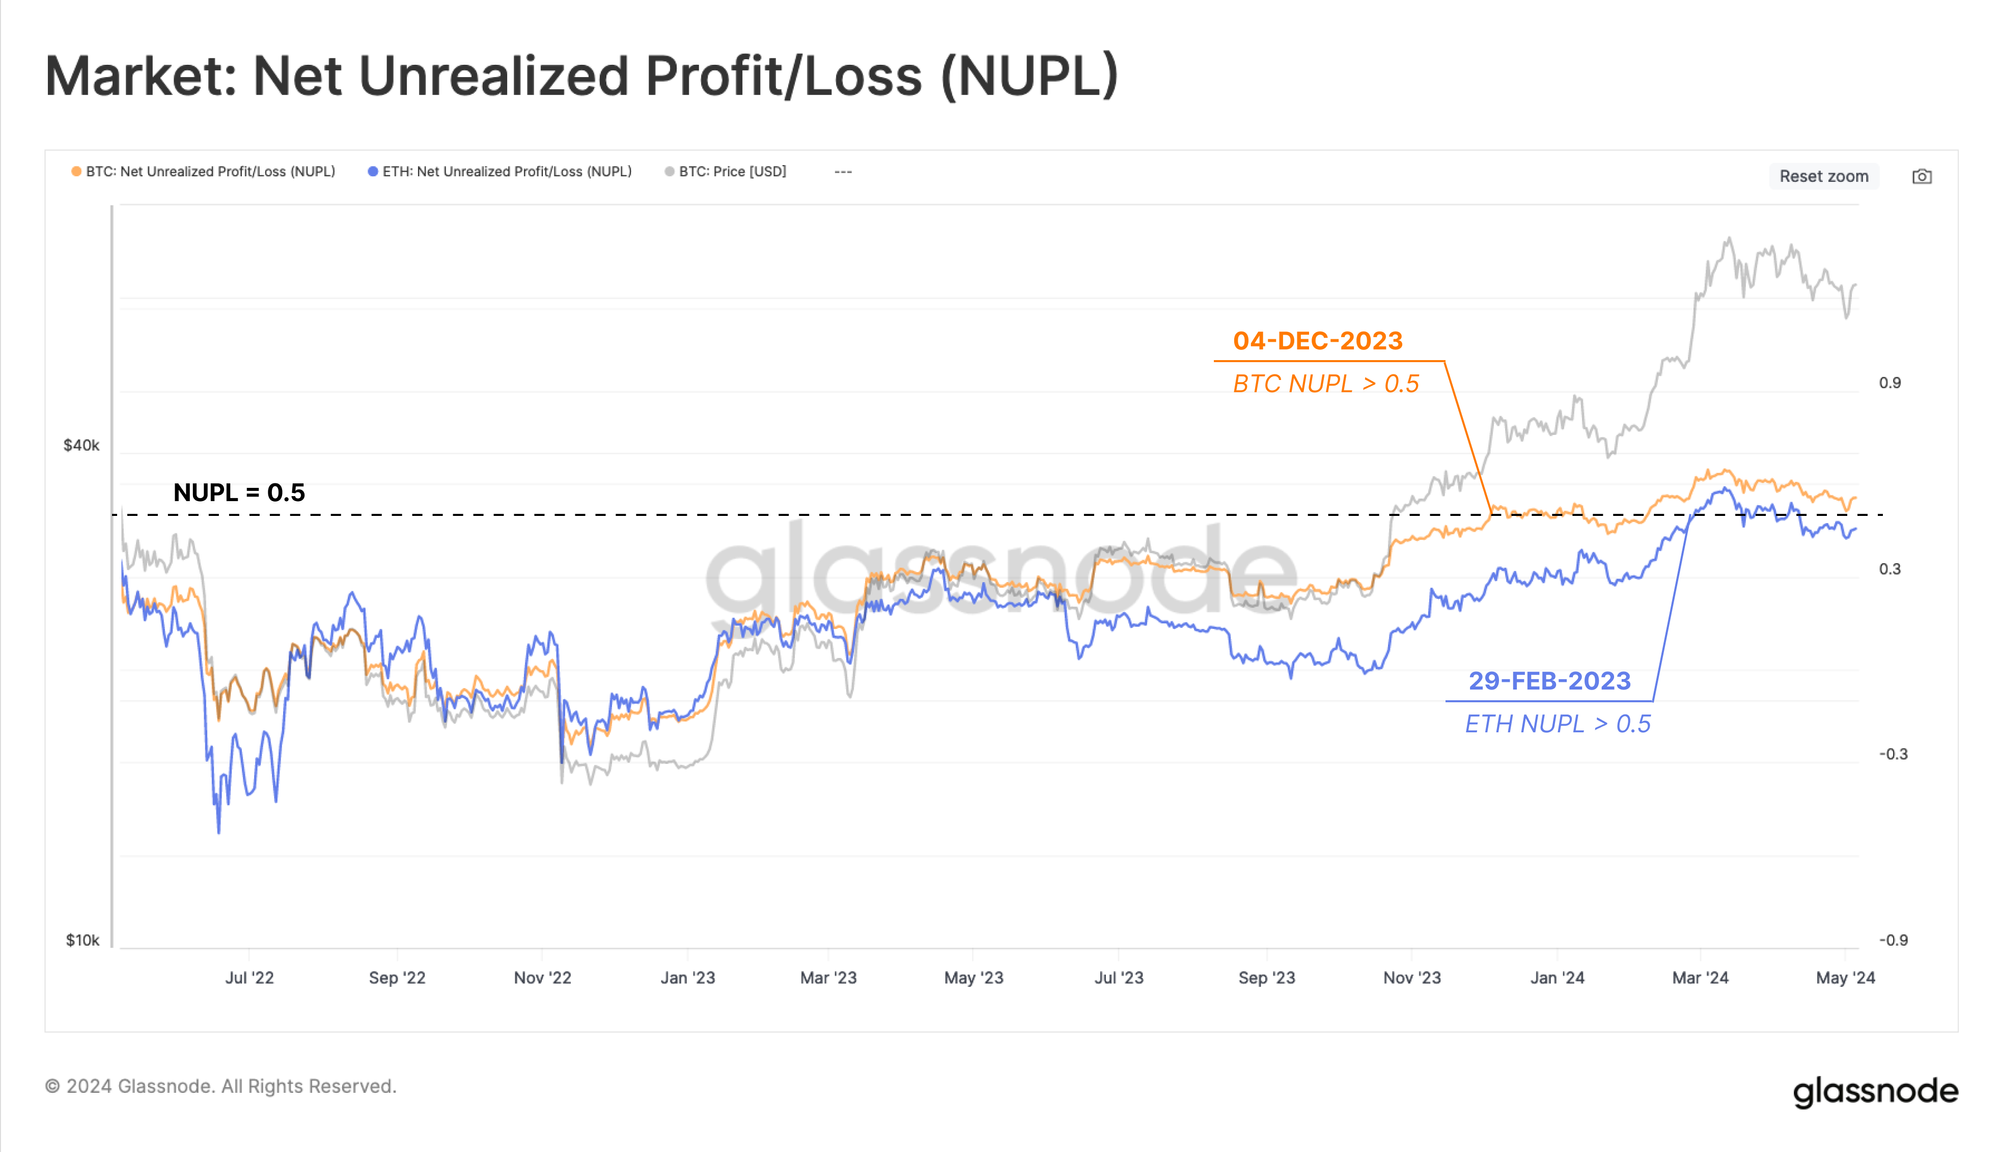
In order to compare relative performance between BTC and ETH, we can turn to the Net Unrealized Profit/Loss (NUPL) metric. Comparing NUPL allows us to see how the profitability of BTC vs ETH investors has fared relative to the average on-chain cost basis for each asset.
A major threshold for this indicator is NUPL > 0.5, which generally aligns with the breaking to new ATHs, and the beginning of the Euphoria phase. A NUPL value above 0.5 signifies that the unrealized profit held by investors exceeds 50% of the asset market cap value.
Amidst the hype and market rally surrounding approval of the spot Bitcoin ETFs, the unrealized profit of Bitcoin holders expanded considerably faster than that of Ethereum investors. As a result, the Bitcoin NUPL metric crossed 0.5 and entered the euphoria phase three months before than equivalent metric for Ethereum.
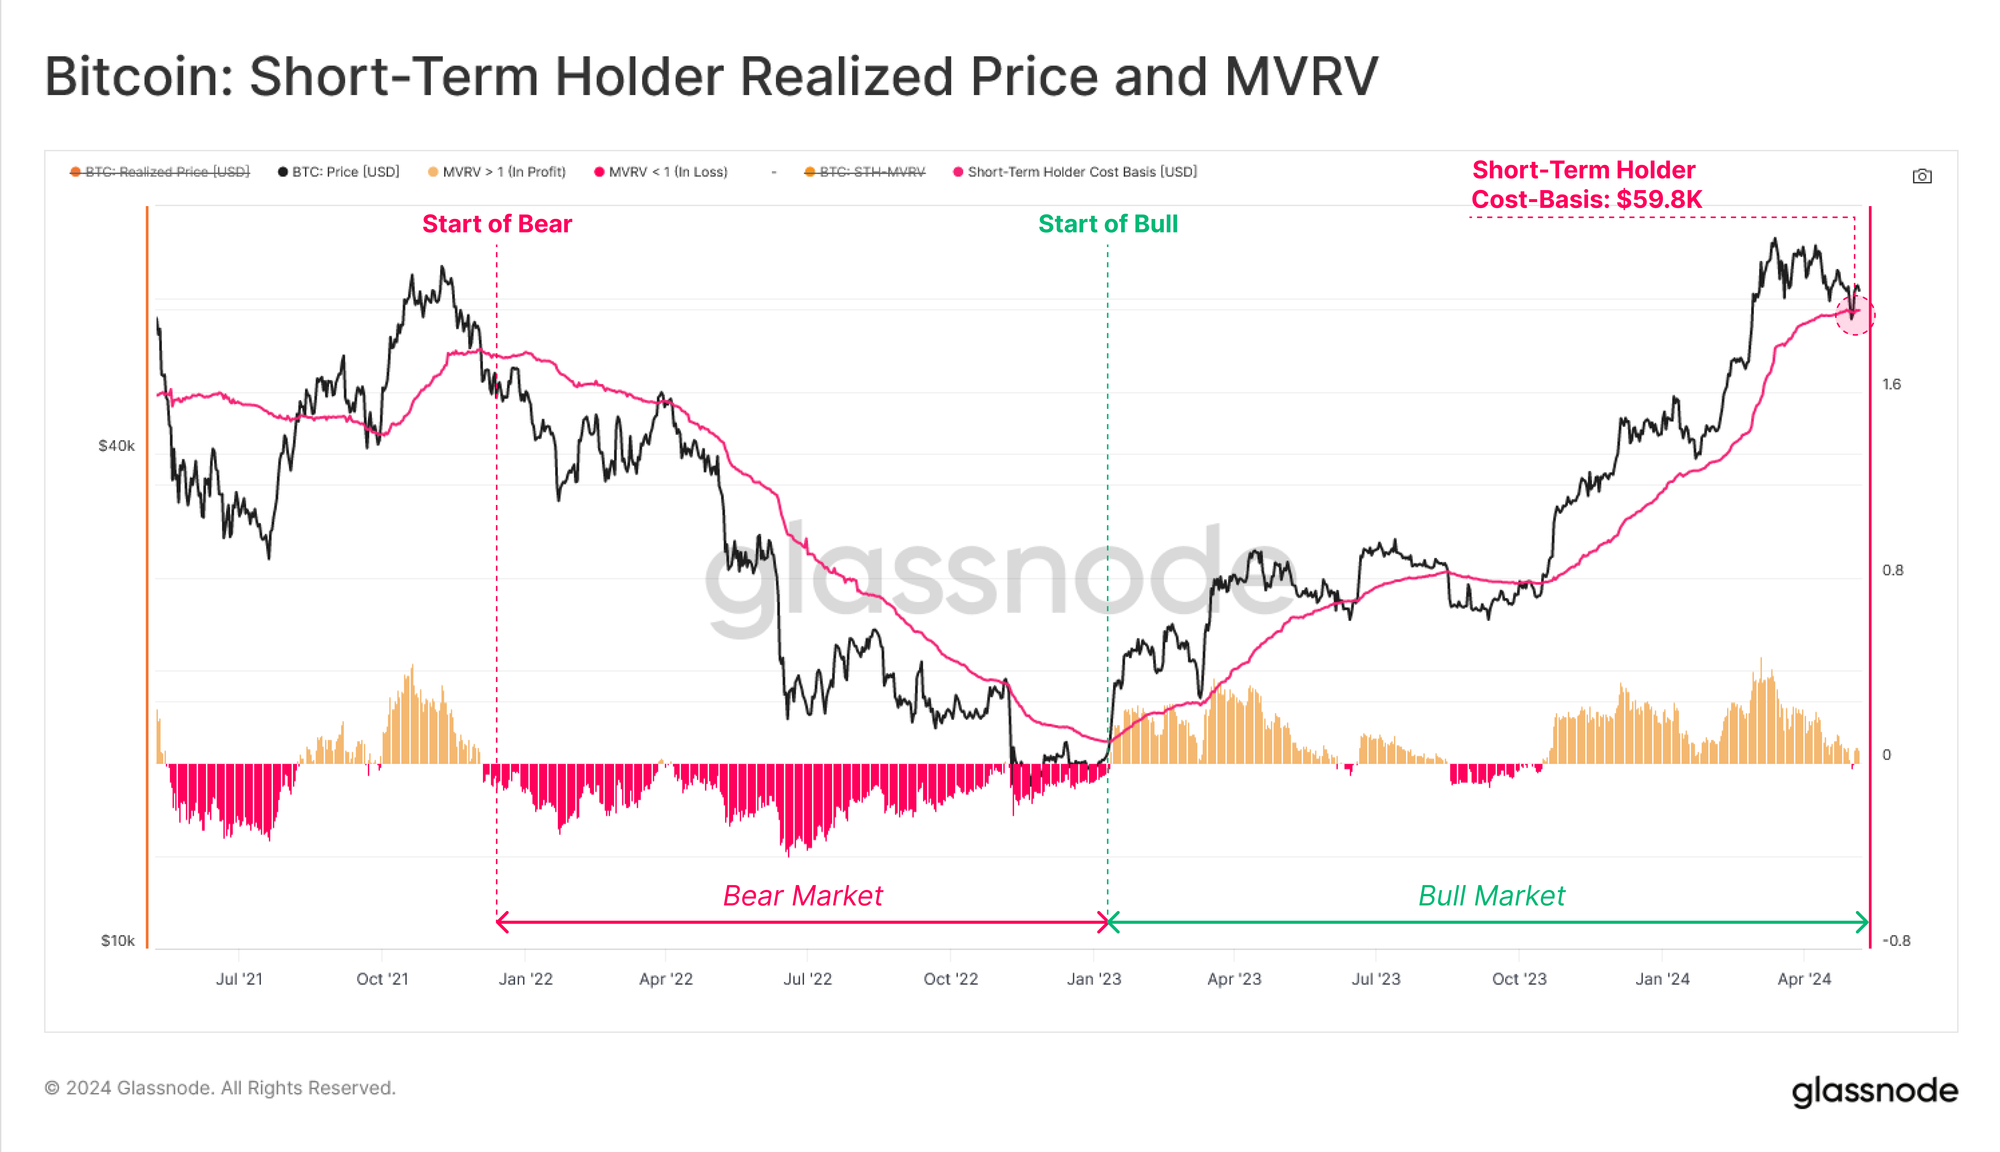
The Short-Term Holder cohort consists of investors who acquired their coins within the last 155 days, and are often considered a proxy for new investor demand. Typically, the average acquisition price of the cohort has acted as strong resistance during bearish trends, and a region of support during bullish trends.
This thesis has held up so far this week, with the Bitcoin market correcting down below the STH-Cost Basis at $59.8k, where it found support and rallied higher. Historically speaking, retests of the STH Cost Basis are common during up-trends, and provide a key level for monitoring potential inflection points should it fail to hold.
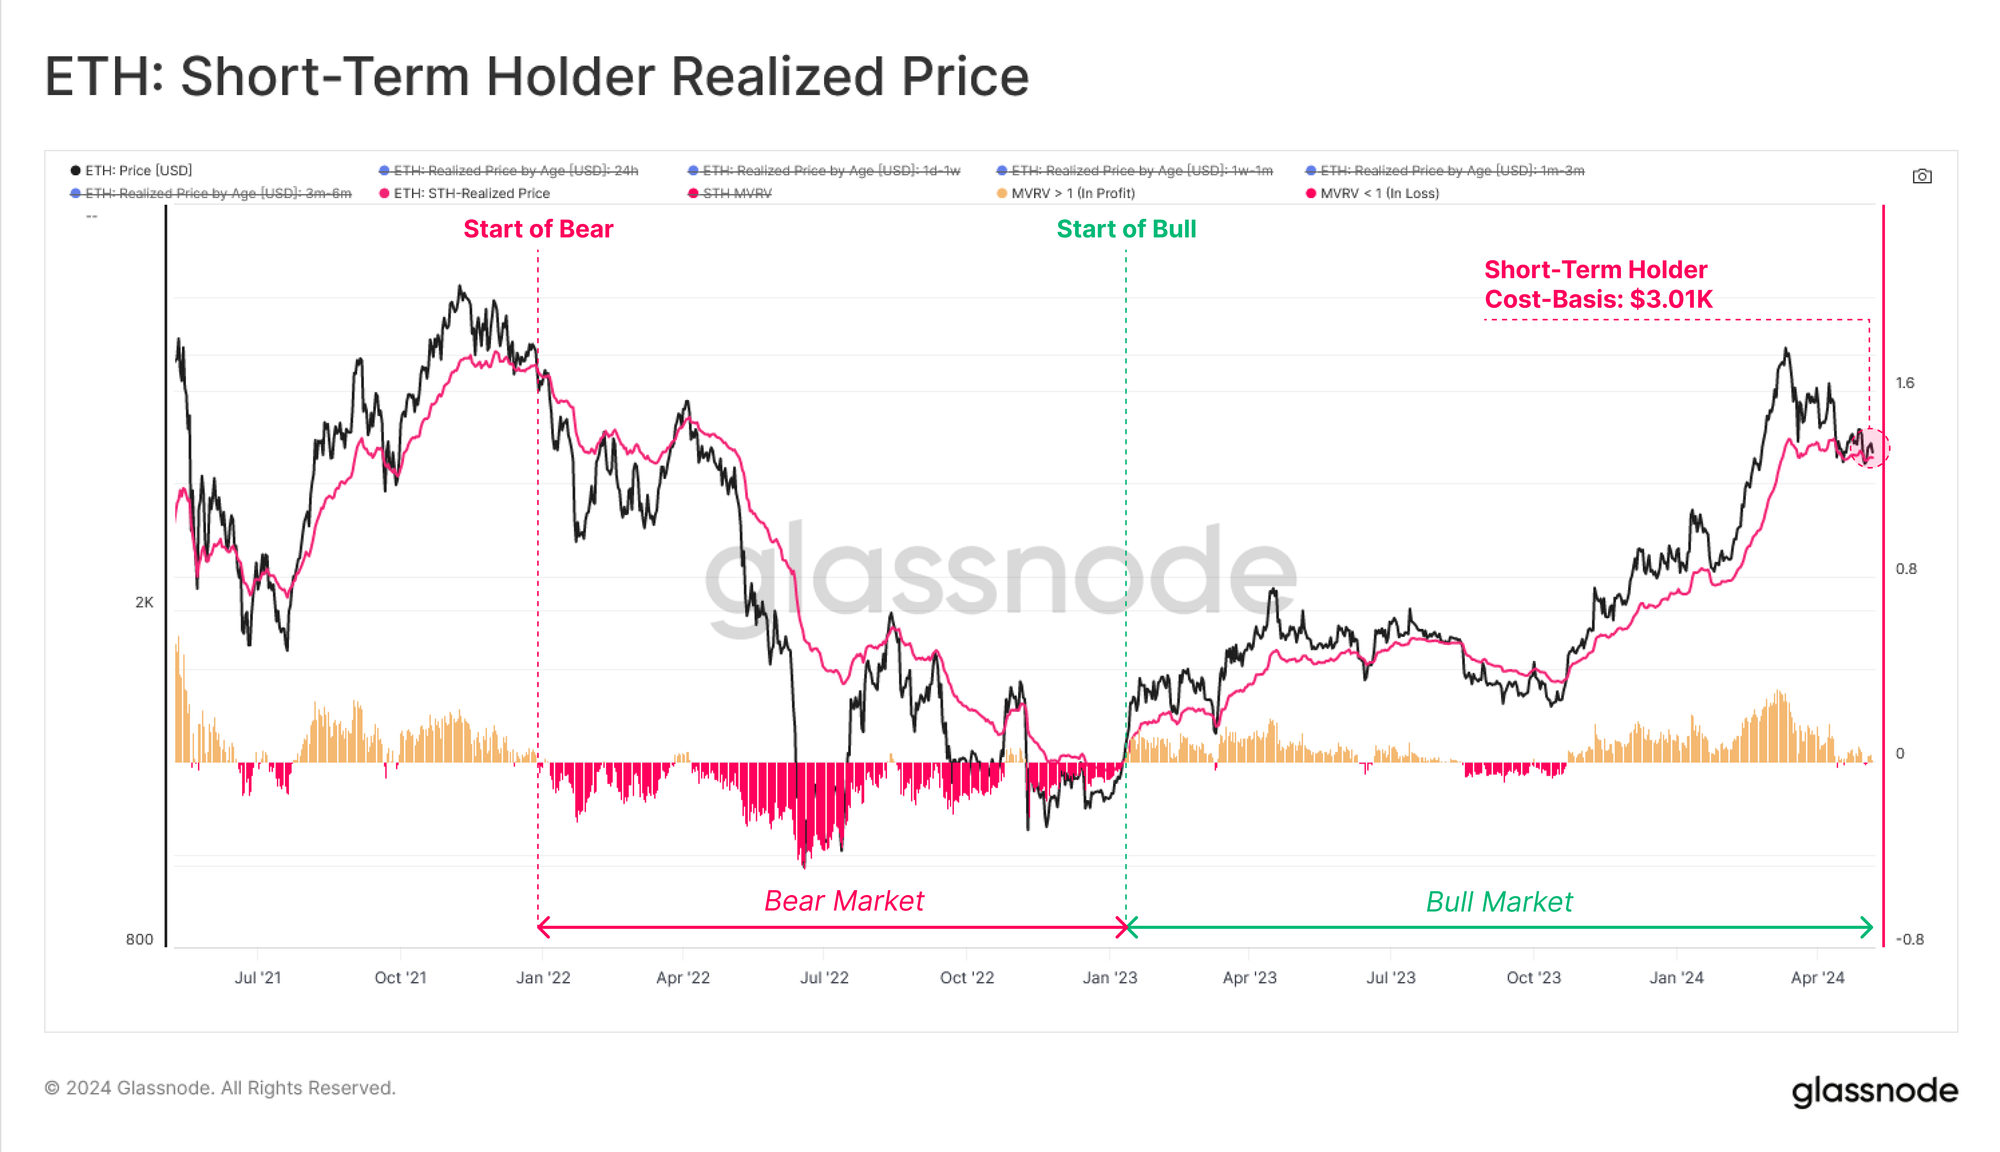
We can assess the STH Cost Basis for Ethereum as well, which has provided support on several occasions in this uptrend already. Ethereum's STH-MVRV is trading at a very slight premium at the moment, which could suggest that spot prices are very close to the cost basis of recent buyers, who may panic should the market experience downside volatility.
A Growing Divergence
In the run-up to Bitcoin's all-time high (ATH) on 14-March, there was a noticeable increase in speculative activity. Specifically, capital accumulation has been observed among short-term holders, with the USD wealth held withing coins moved within the last 6 months approaching $240B, near ATHs.
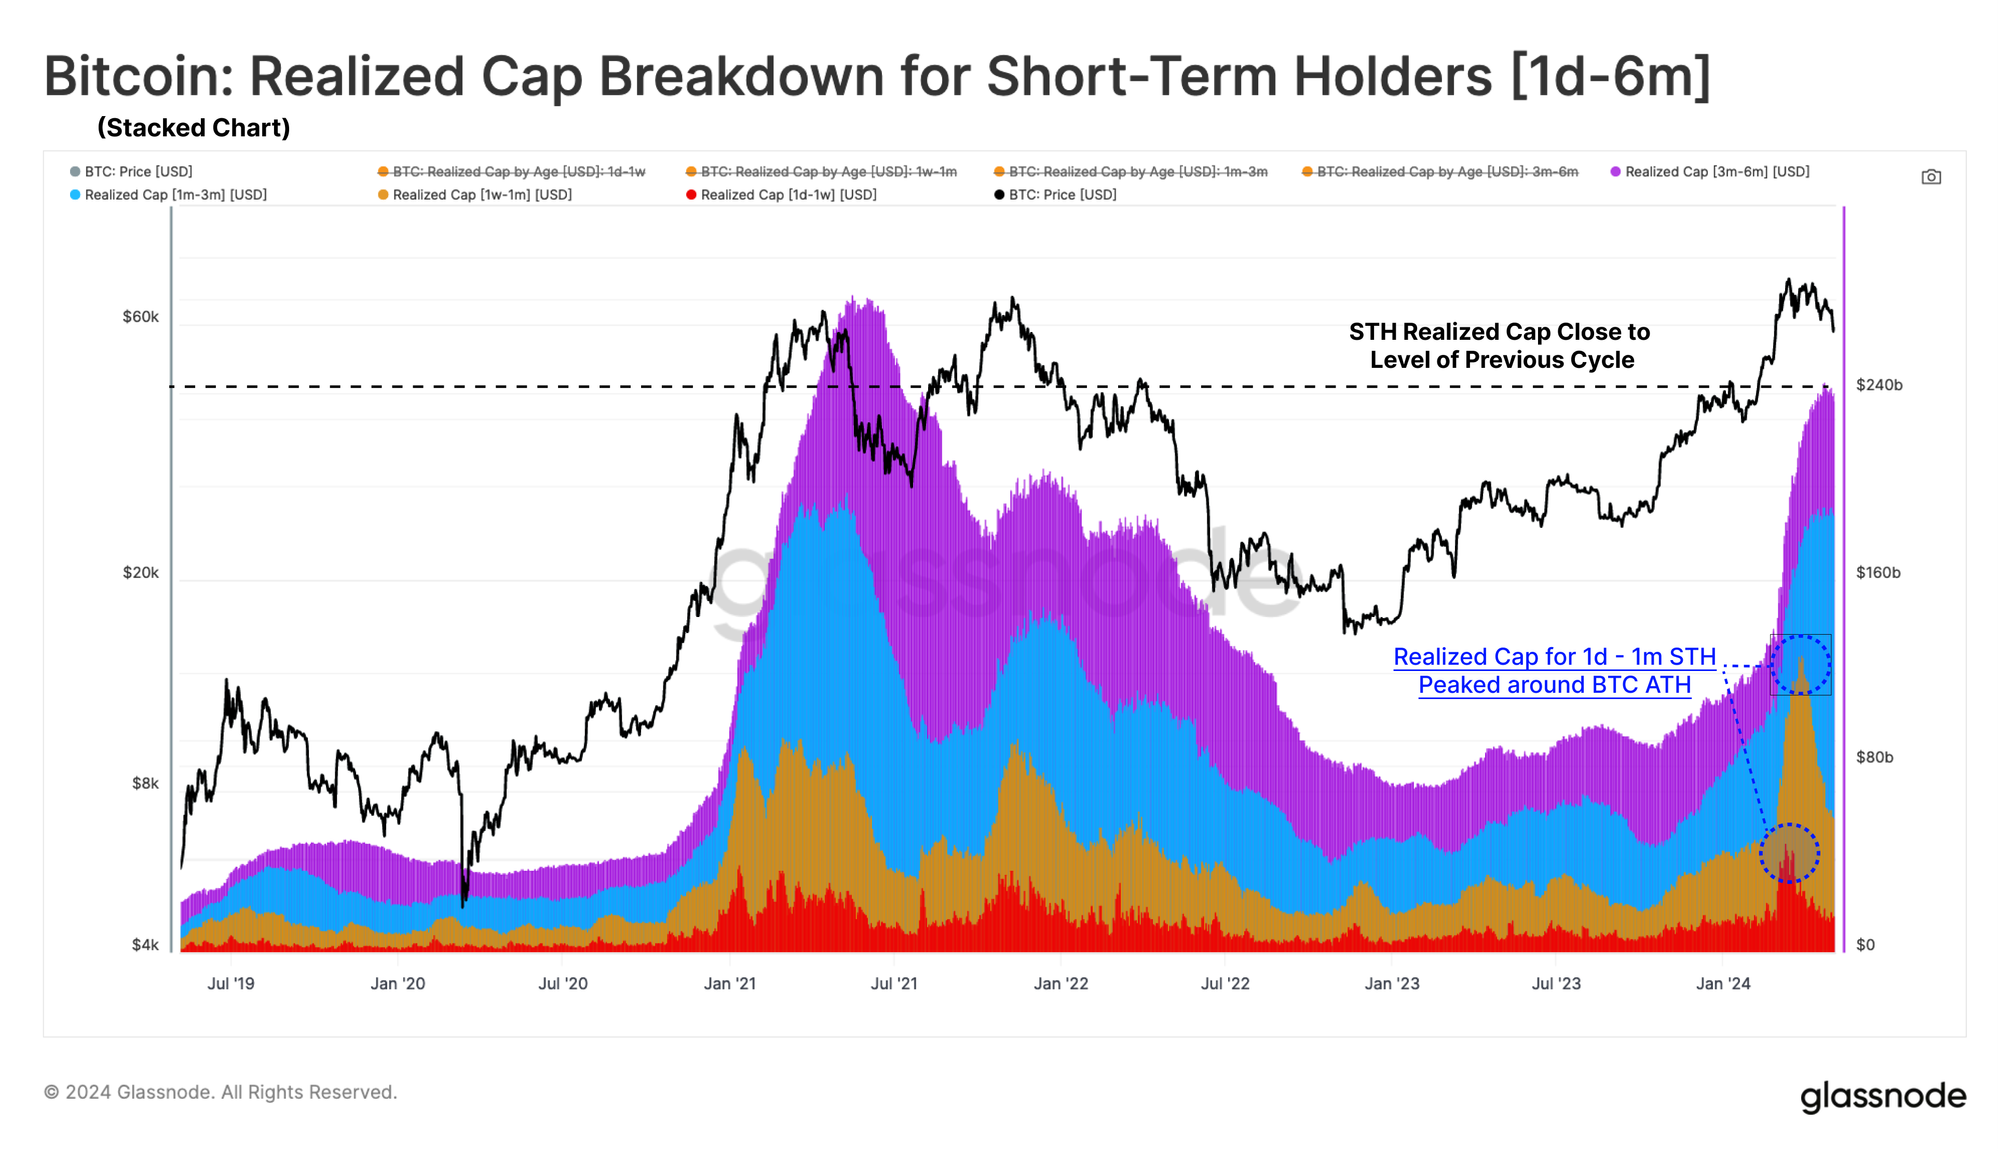
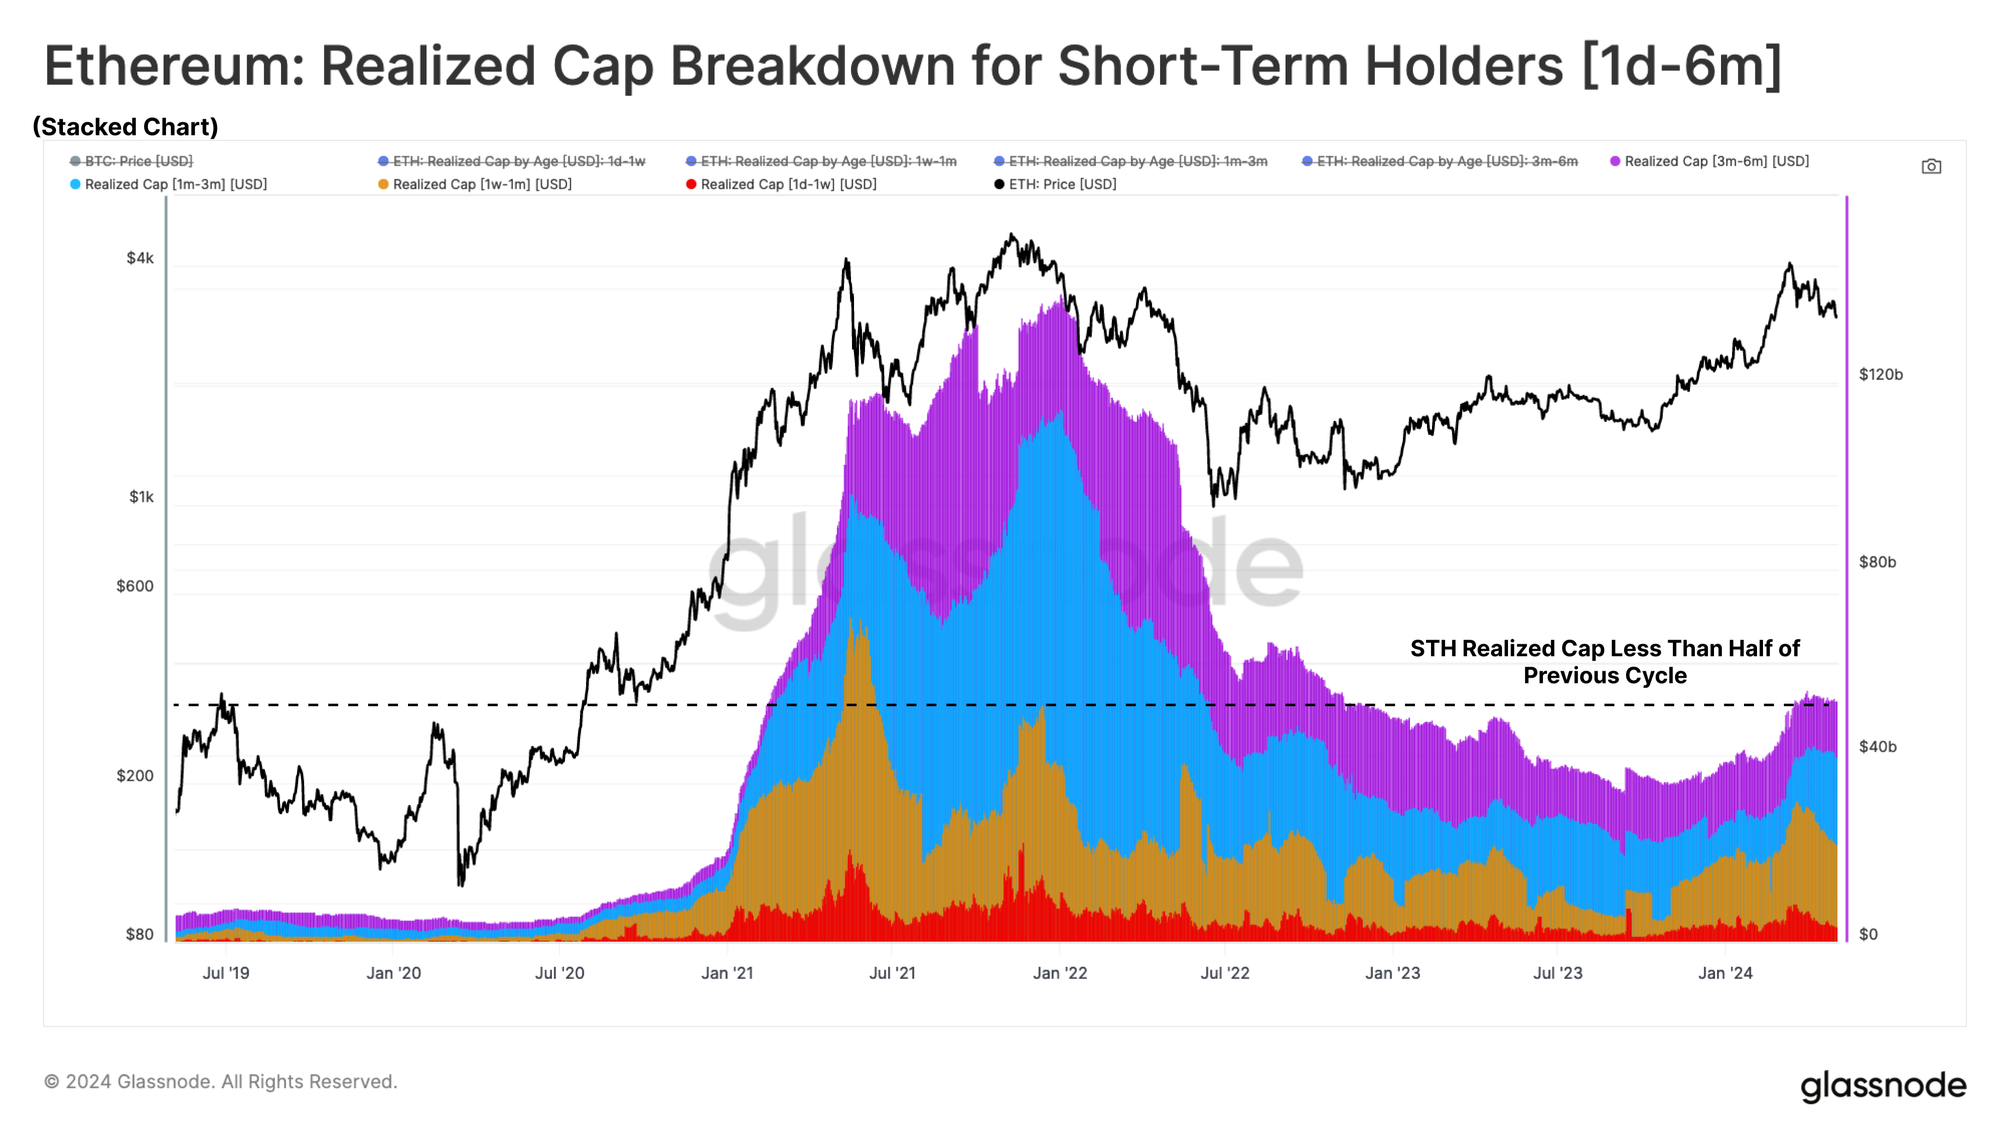
However, this trend has not been mirrored for ETH, which has not yet seen price break above the 2021 ATH yet. Whilst Bitcoin's STH-Realized Cap is nearly on par with the last bull run peak, ETH's STH-Realized Cap has barely lifted off the lows, suggesting a markedly lacklustre inflow of new capital.
In many ways, this lack of new capital inflows is a reflection of the under-performance of ETH relative to BTC. This is likely in part due to the attention and access brought about by the spot Bitcoin ETFs.
The market is still awaiting the SEC's decision for approval of a suite of ETH ETFs expected towards the end of May.
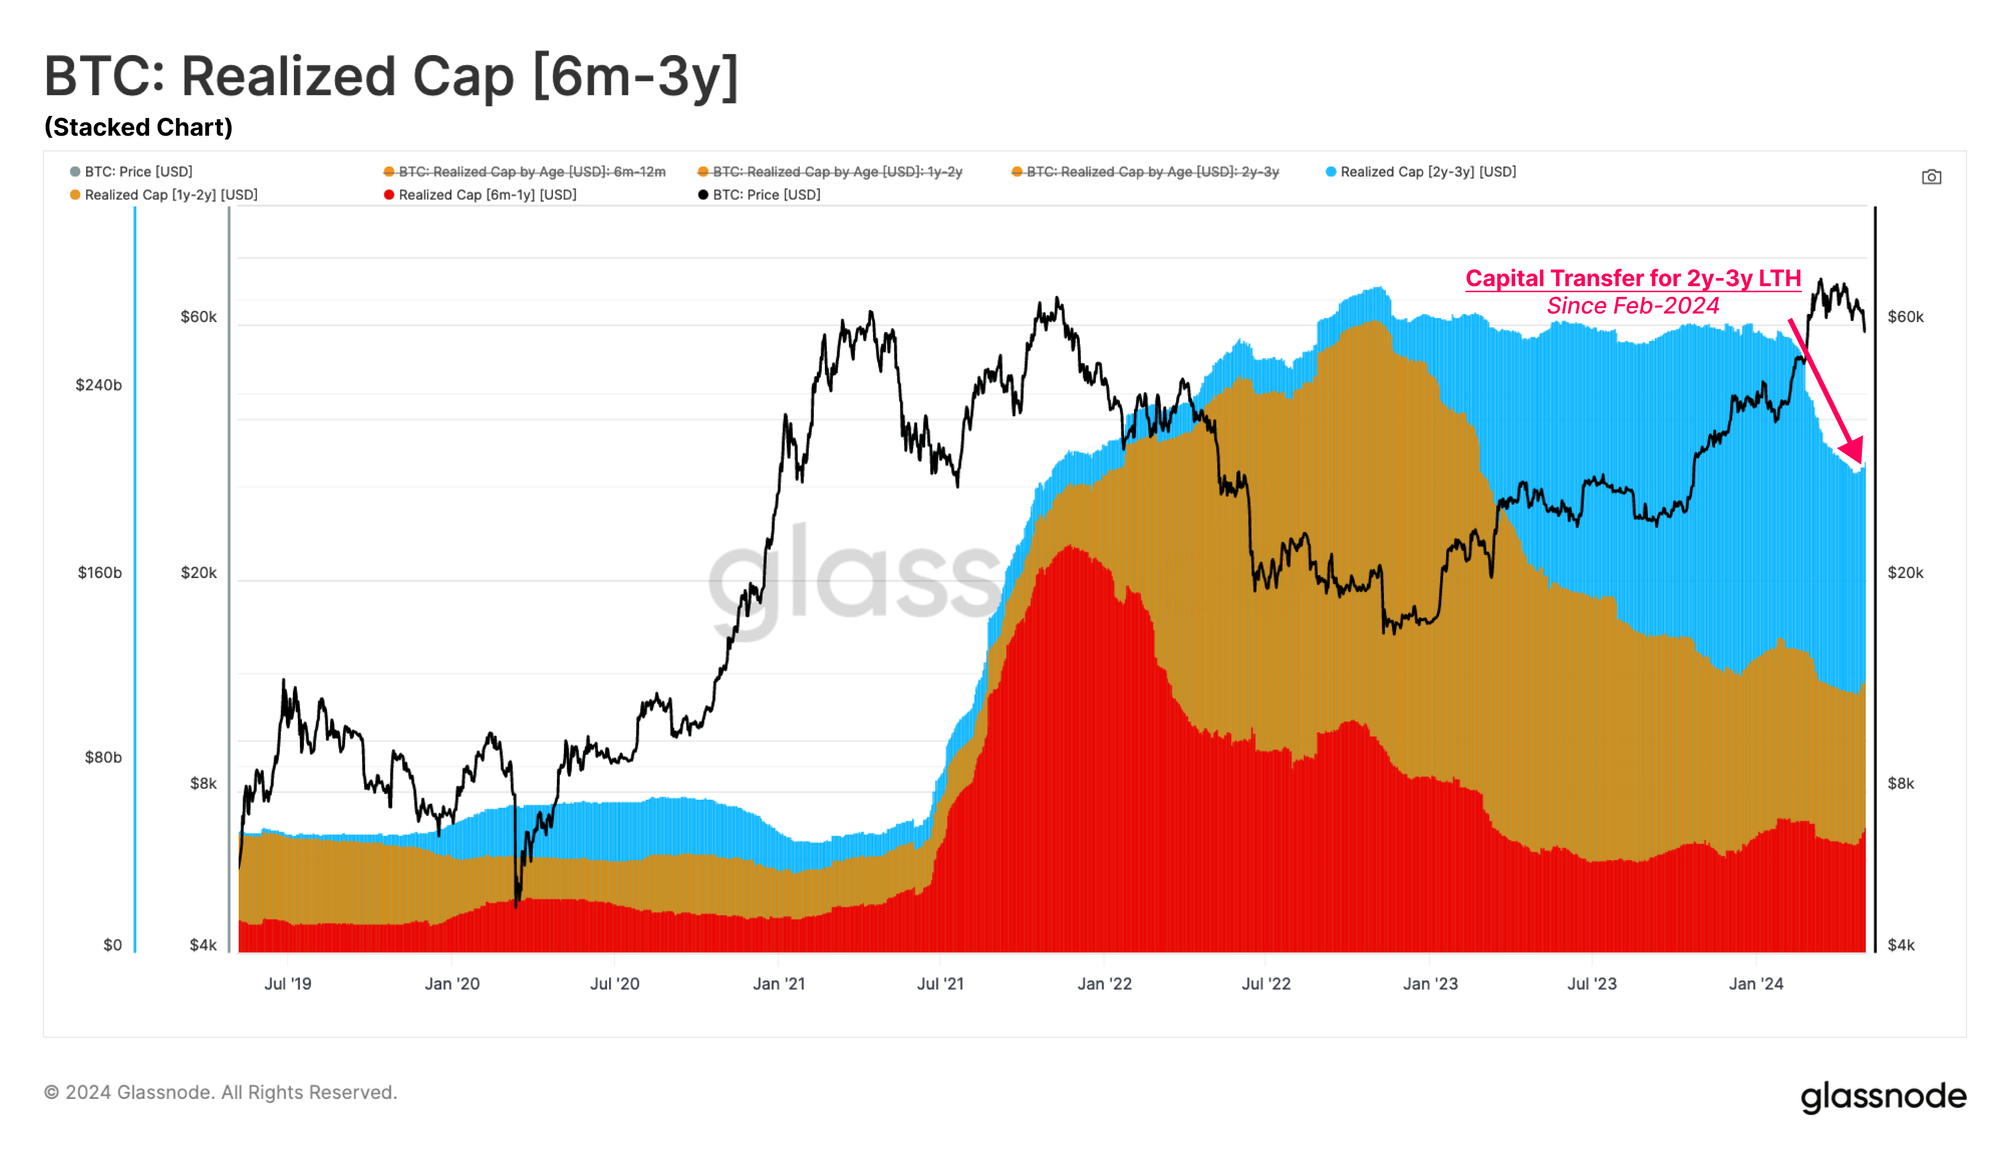
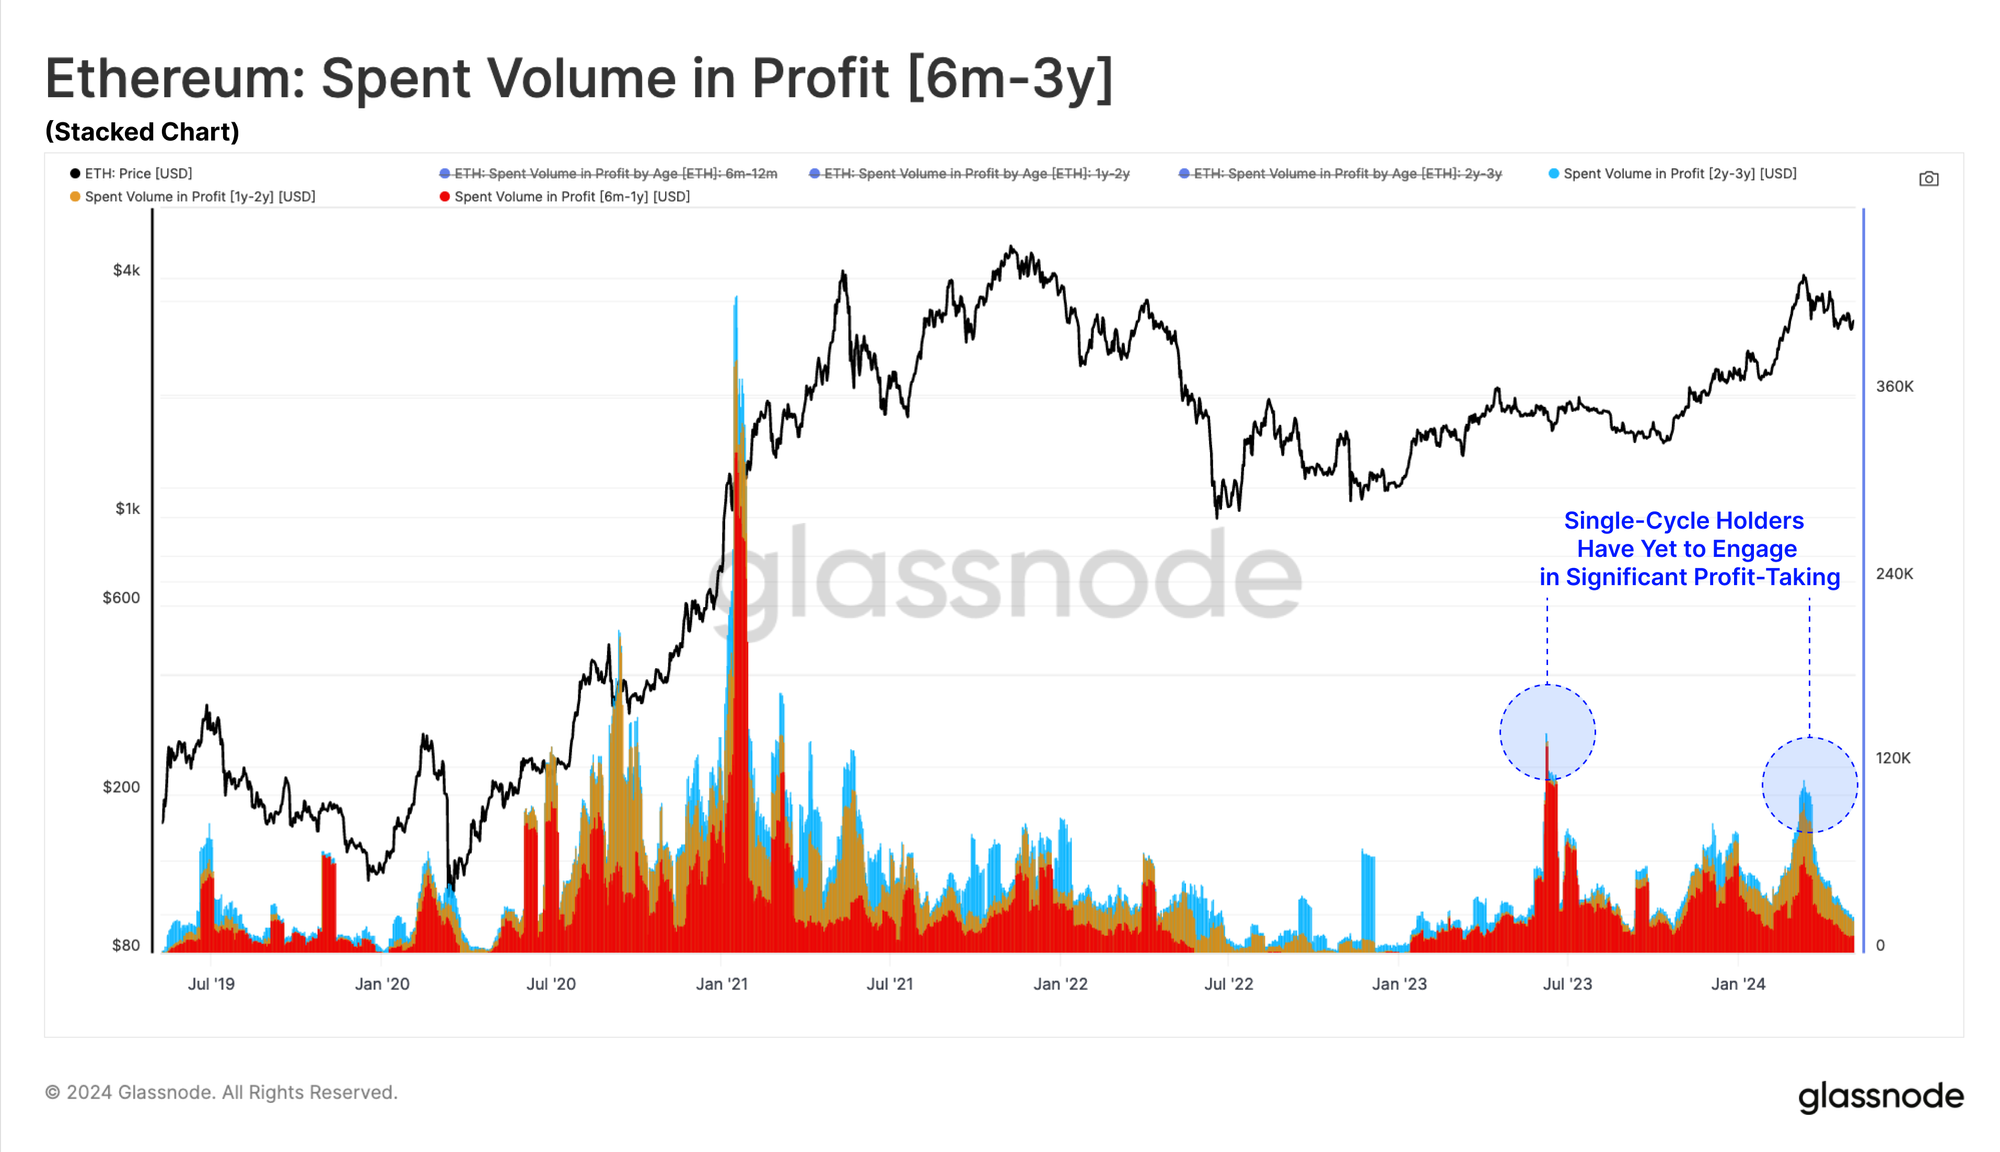
We can take a similar analysis approach related to the Long-Term Holders, were we notice a significant decline taking place within the 2 to 3-year cohort. Some portion of this are coins acquired 3yrs ago (May 2021) maturing into the 3y-5y age band, but the rest an indication of profit taking an divestment.
This was likely influenced by the approval of the ETFs, with a significant proportion of this divestment occurring in February 2024, as the market rallied, and was about a month prior to BTC reaching its current $73k ATH. These Long-Term Holders historically wait for strong demand inflows to take profits into market strength.
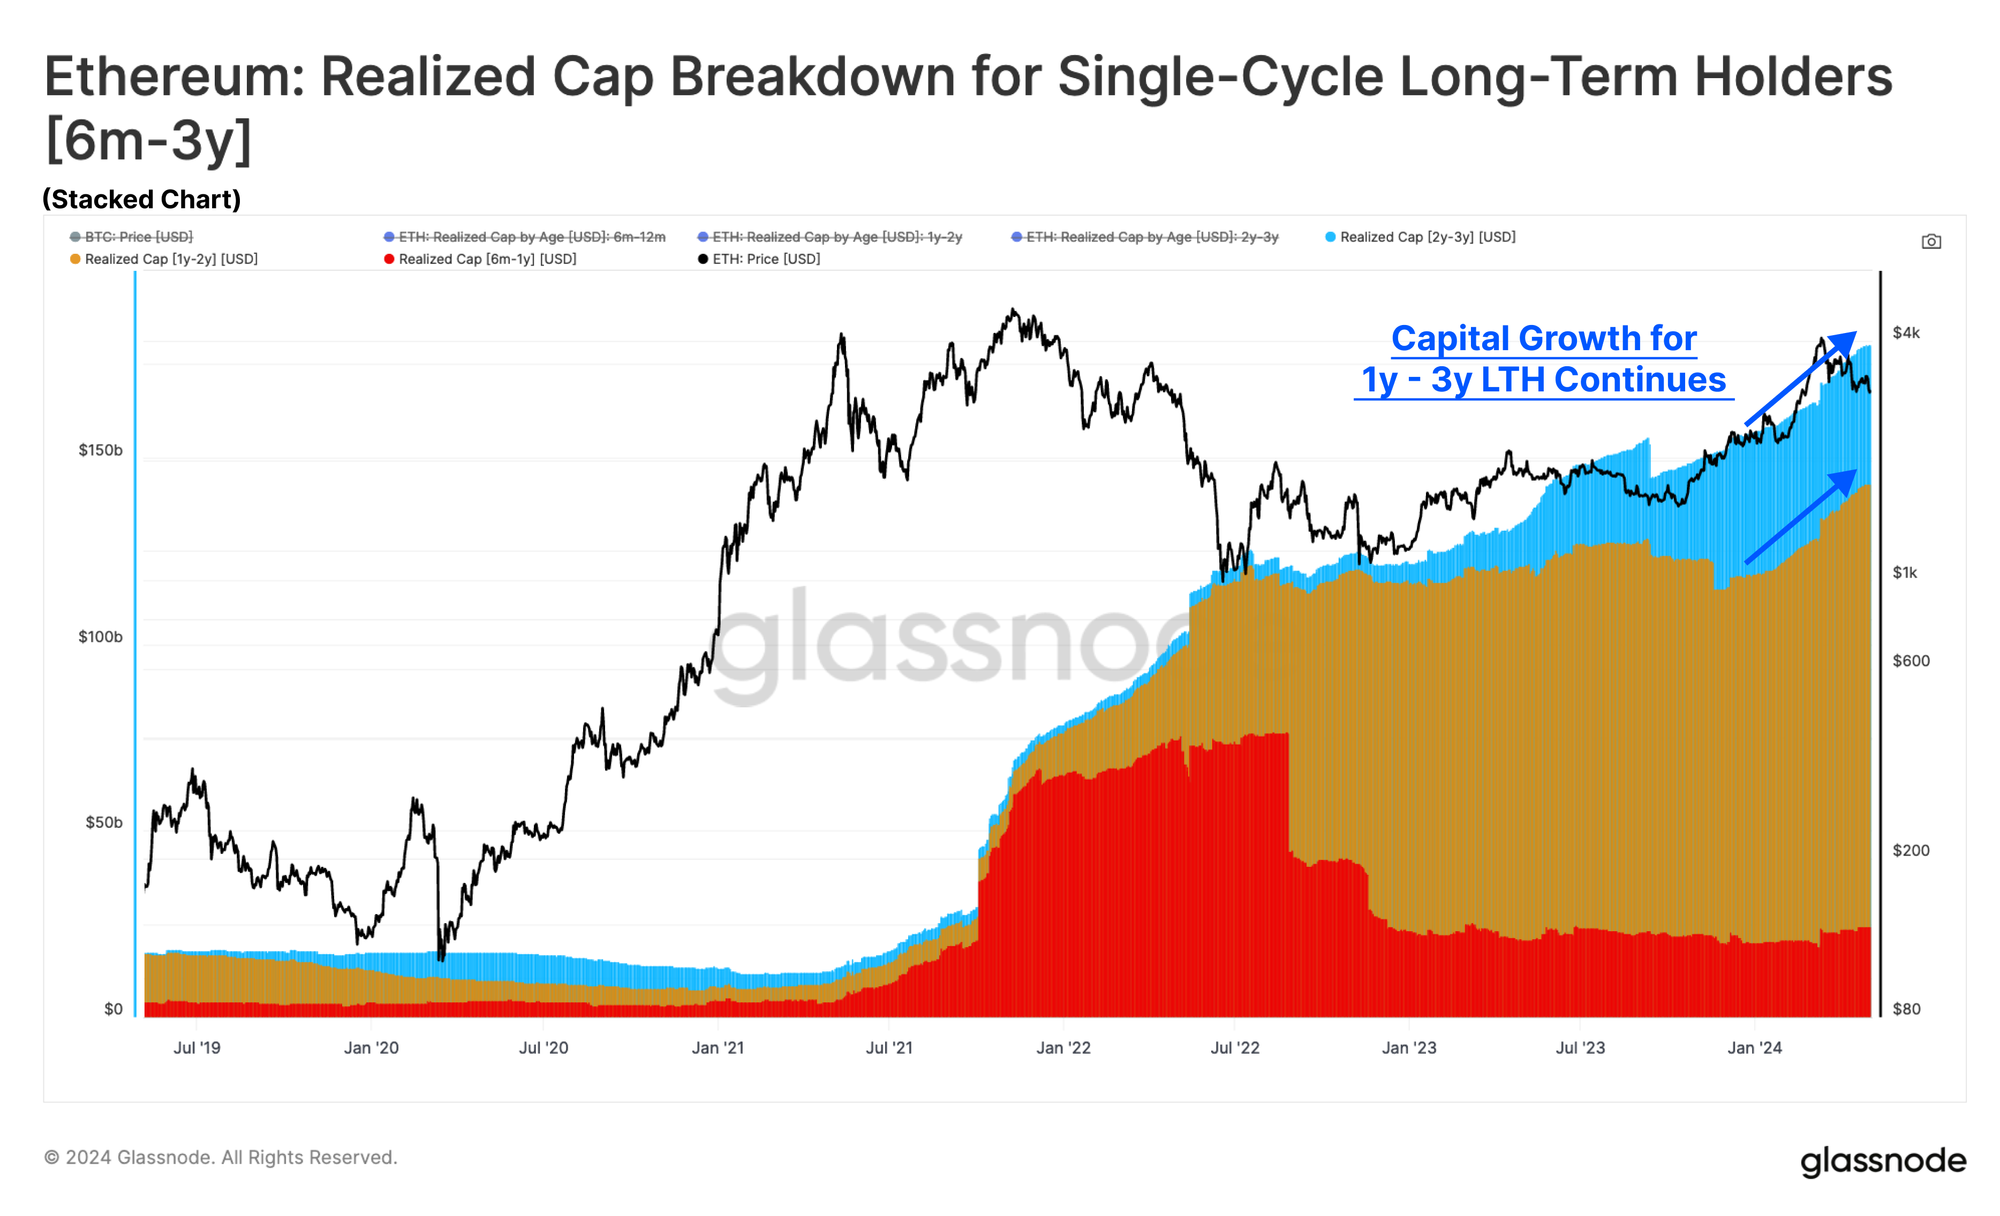
For Ethereum, we continue to see ongoing HODLing behaviour, particularly in the 1 to 3-year cohorts. It appears that due to ETH's current under-performance, seasoned investors are sitting back and waiting patiently for higher prices.
If we examine the Spent Volume in Profit for LTHs, we can see that the cohort of BTC holders who have held for between 6 months and 2 years increased their divestment during the ATH rally.
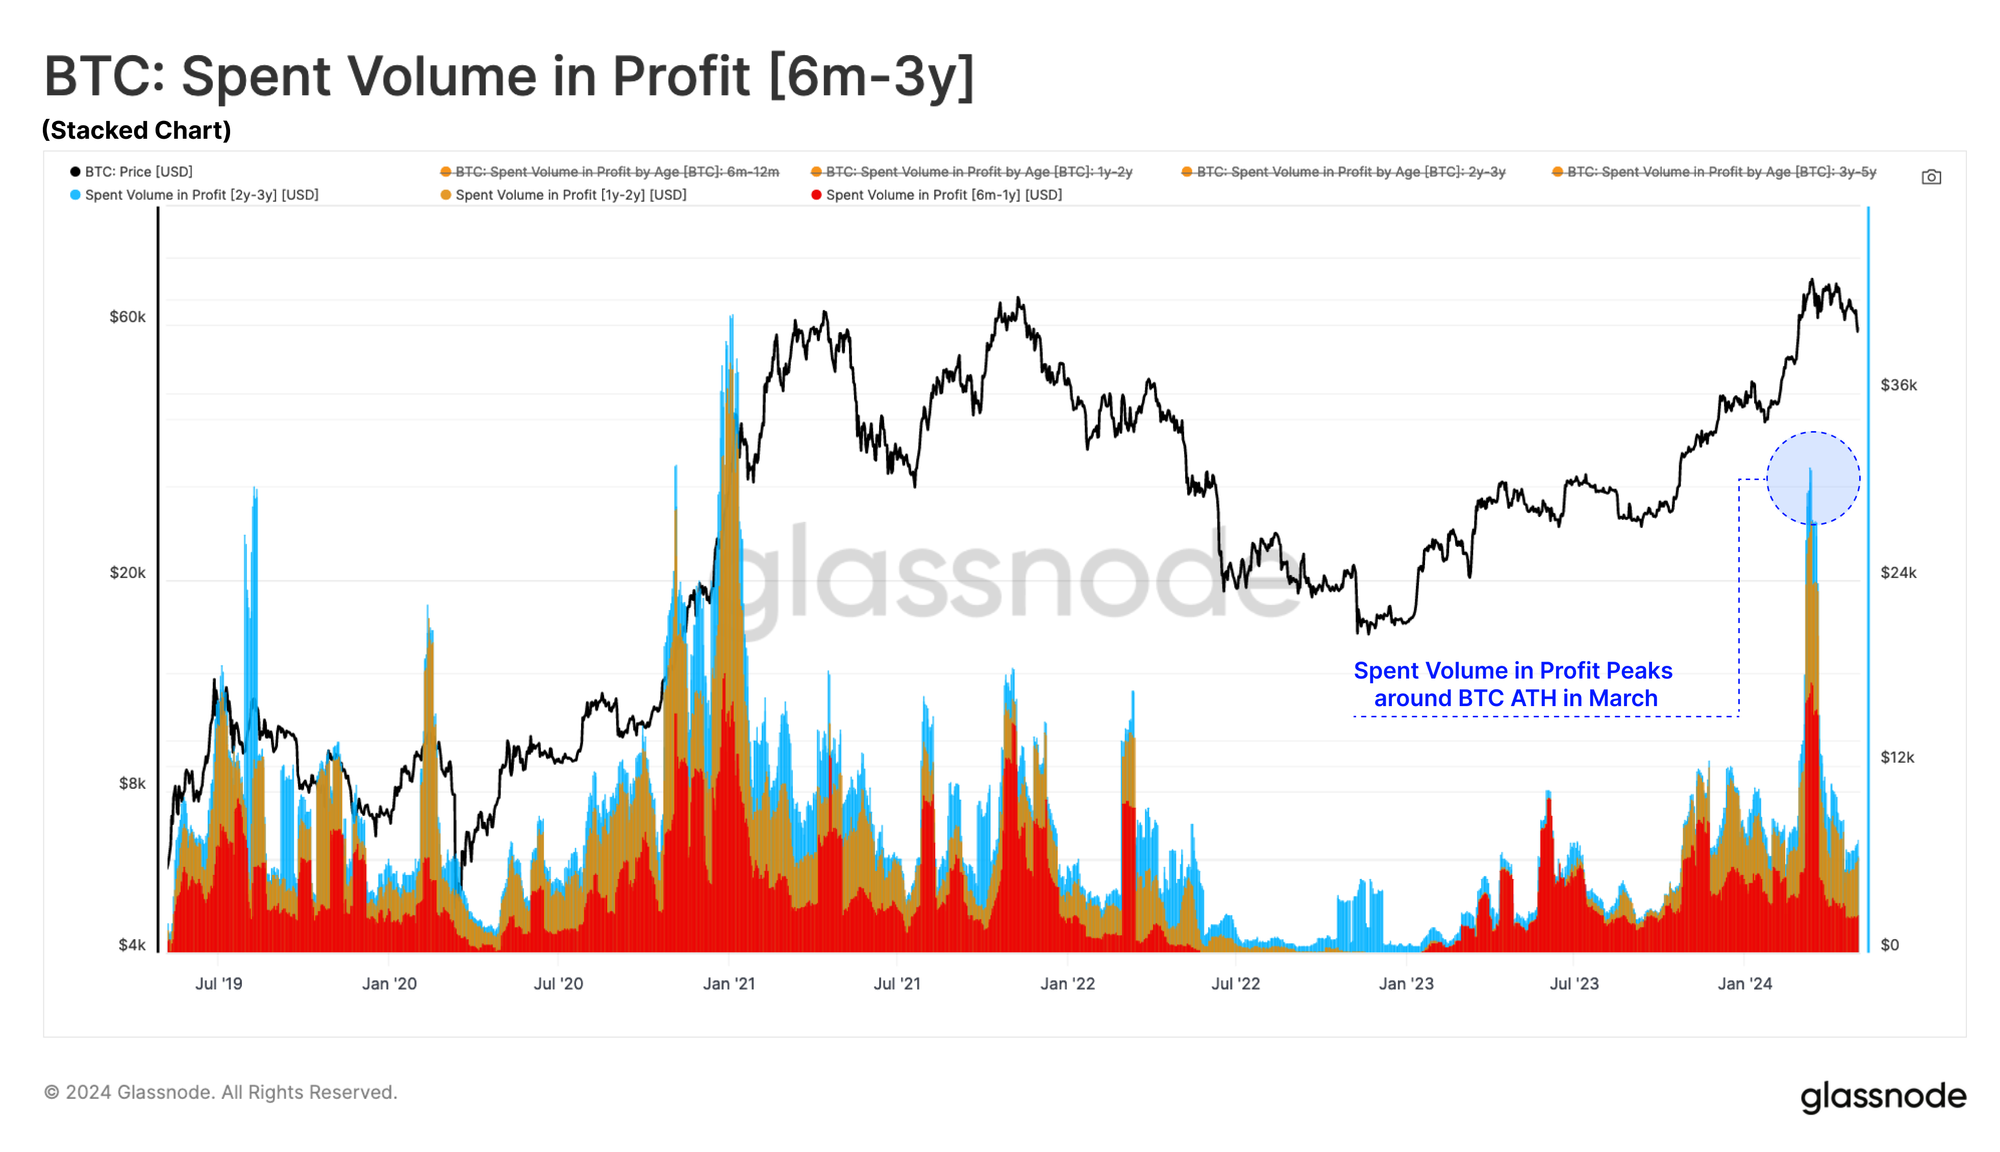
From this lens, Ethereum's Long-Term Holders once again appear to still be waiting for better profit-taking opportunities.
- Bitcoin: Short-Term Holder Profitability Breakdown
- Etherum: Short-Term Holder Profitability Breakdown
- Bitcoin: Single-Cycle LTH Profitability Breakdown
- Ethereum: Single-Cycle LTH Profitability Breakdown
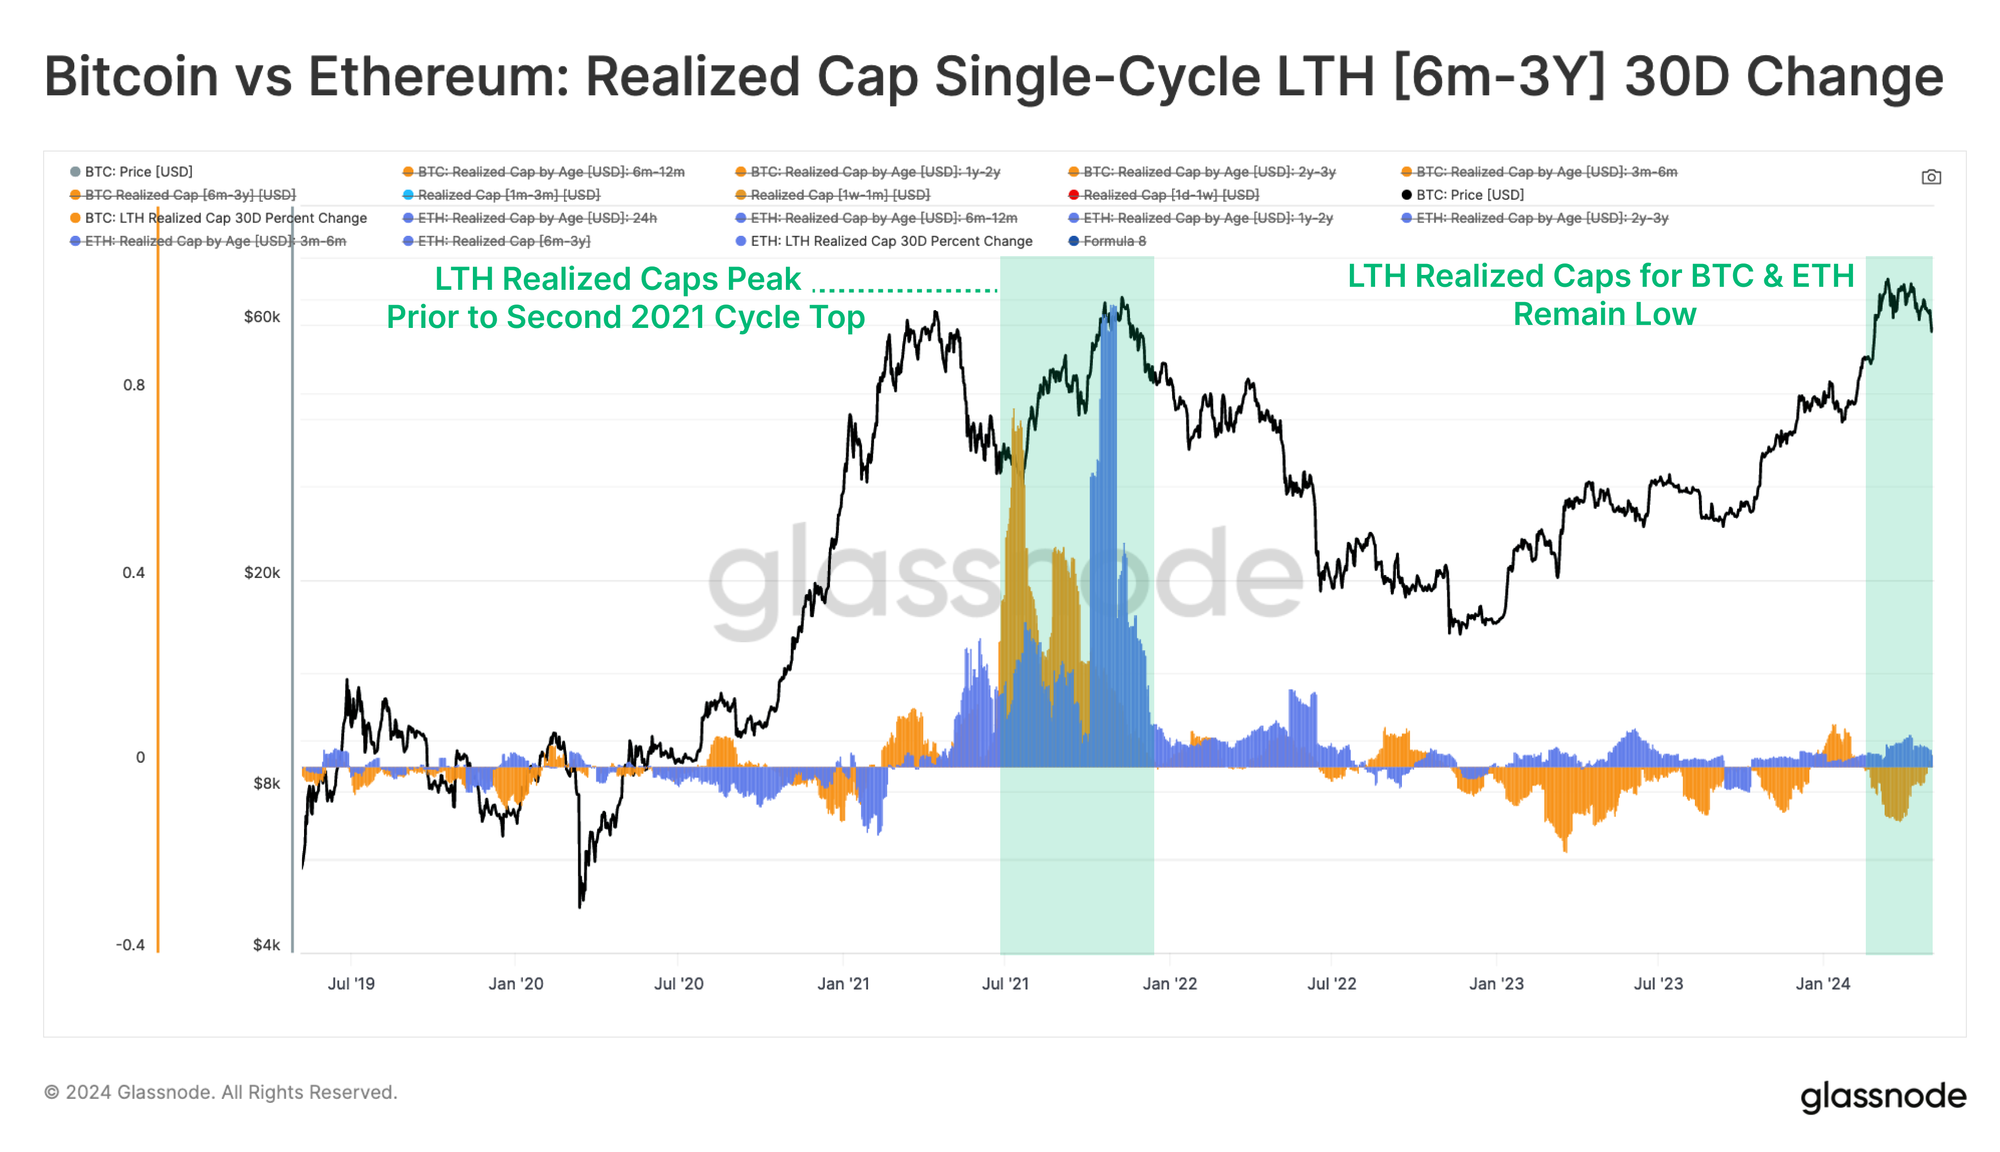
As we established in WoC 08, capital inflows into ETH do tend to lag relative to BTC. In the 2021 cycle, the peak influx of new capital into BTC occurred 20 days before the peak influx into ETH. We can monitor the rotation of capital between these two assets via an assessment of the 30-day change in the Realized Cap.
In this instance, we have broken down this metric by Short and Long-Term Holders. For both assets, the Short-Term Holder variant peaked before the 2021 cycle top across both assets. This year, the BTC short-term holder Realized Cap has peaked around the new all-time high, whilst the ETH metric has hardly moved higher.
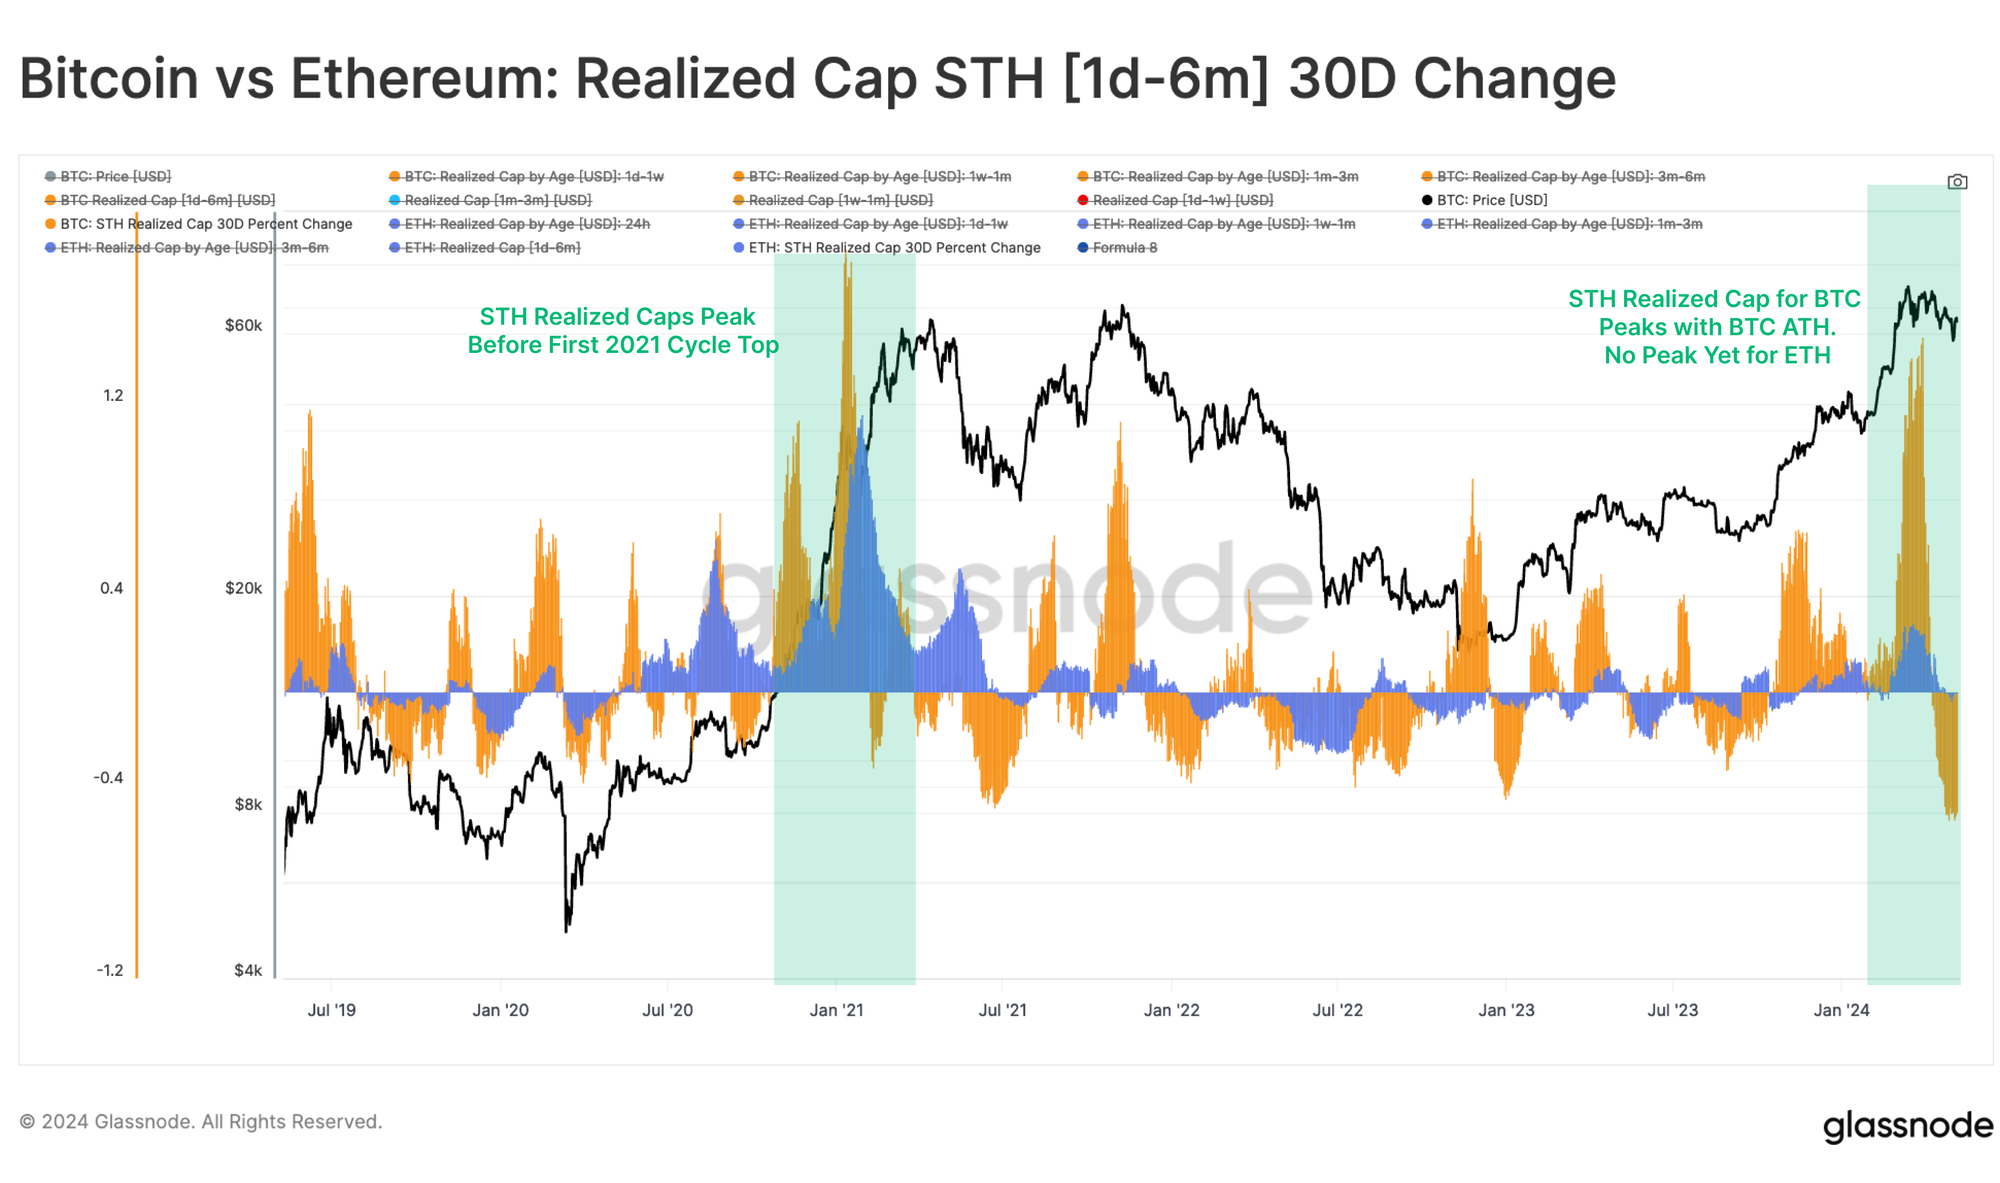
For the Long-Term Holder variant, both assets saw a relative maximum around the second cycle top. This is a very different interpretation, as it takes at least 155-days for capital to reach LTH status.
As such, this metric is describing top buyers from Q1 2021, who first acquired BTC, and then later in ETH, and who held onto their supply into the Oct-Nov 2021 peak. These buyers were likely the ones who weathered, and contributed to sell-side pressure throughout the 2022 bear market that followed.
Summary and Conclusion
Market action around the fourth Bitcoin halving was remarkably similar to prior cycles, with a temporary price drop to $57k, before rebounding to be flat overall. Ethereum markets followed a similar trajectory, however several metrics provided color to ETHs under-performance relative to BTC.
When we break down capital flows and rotation between BTC and ETH, we can see that Bitcoin has received the lions share of inflows, likely driven in part by the US spot ETFs. Short-Term Holders and speculation activity appears concentrated within Bitcoin, with a remarkably weak spill-over into Ethereum thus far.
Disclaimer: This report does not provide any investment advice. All data is provided for information and educational purposes only. No investment decision shall be based on the information provided here and you are solely responsible for your own investment decisions.
Exchange balances presented are derived from Glassnode’s comprehensive database of address labels, which are amassed through both officially published exchange information and proprietary clustering algorithms. While we strive to ensure the utmost accuracy in representing exchange balances, it is important to note that these figures might not always encapsulate the entirety of an exchange’s reserves, particularly when exchanges refrain from disclosing their official addresses. We urge users to exercise caution and discretion when utilizing these metrics. Glassnode shall not be held responsible for any discrepancies or potential inaccuracies. Please read our Transparency Notice when using exchange data.
- Join our Telegram channel
- For on-chain metrics, dashboards, and alerts, visit Glassnode Studio
- For automated alerts on core on-chain metrics and activity on exchanges, visit our Glassnode Alerts Twitter